2.
Navigating Your Code With Breakpoints
Written by Vincenzo Guzzi
Breakpoints are used for debugging purposes in software development. A breakpoint is an intentional place or pause in a program where you can suspend your program or data can be retrieved and logged.
Breakpoints are the backbone of any good IDE and a powerful tool in a developer’s toolbox; Android Studio is no different!
If you’ve worked with any Android code before, you’re sure to have used these useful little red circles many times to help locate a bug or simply to try and get a better understanding of your code.
You might think that you know all there is to know about breakpoints in Android Studio, but just breaking on a code line only scratches the surface of how powerful breakpoints can be.
This chapter will teach you how to become a breakpoint power user.
You’ll learn:
- How to set breakpoints and navigate your paused app.
- What conditional breakpoints are and how to use them.
- How to utilize unsuspended breakpoint conditions to help locate bugs.
- How to use breakpoints to log helpful information.
Setting Your First Breakpoint
There are several different types of breakpoints you can use in Android Studio. The most common type of breakpoint, and the one that you’re probably the most familiar with, is a breakpoint that stops the execution of your app code at a specific place. While your app is in a paused state, you can view variable values, evaluate code expressions and continue executing your app line by line.
Open the Podplay starter project in Android Studio and navigate to PodcastActivity.kt.
Add a breakpoint on the first line within onCreate() by clicking inside the left column next to the line of code that states super.onCreate(savedInstanceState).
A red circle will appear on that line in the column, like this:
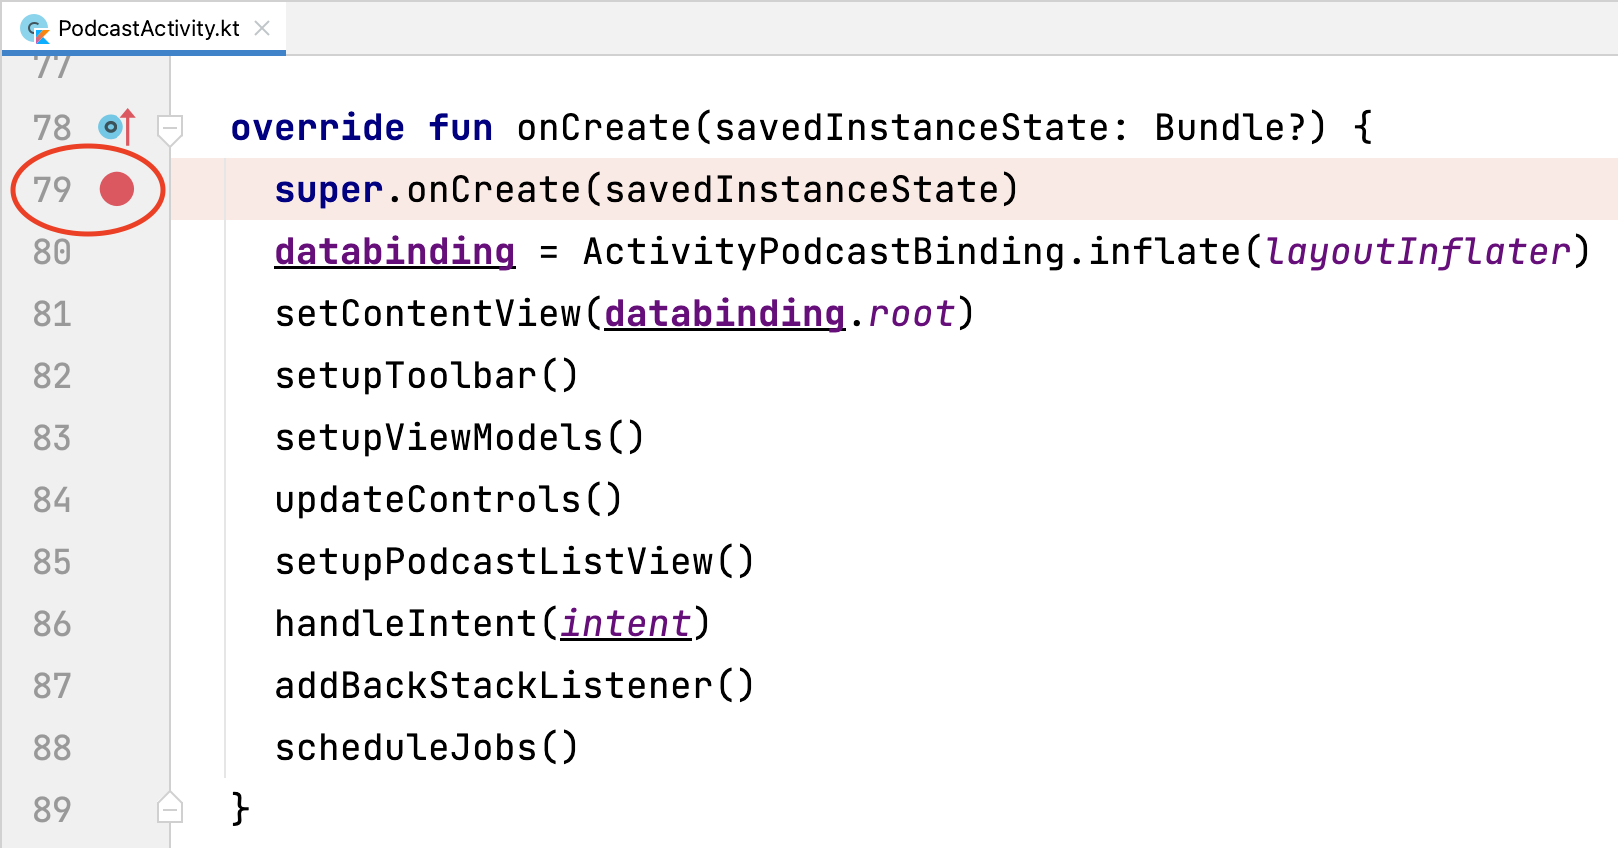
You’ve now created a suspended breakpoint on that line of code. Your app’s execution will pause when it gets to that line inside onCreate().
Run your app in debug mode by going to the Android Studio toolbar and clicking the Debug button:

Your app will load and pause on the breakpoint that you just set. Android Studio will highlight the line of code that it’s currently paused at:
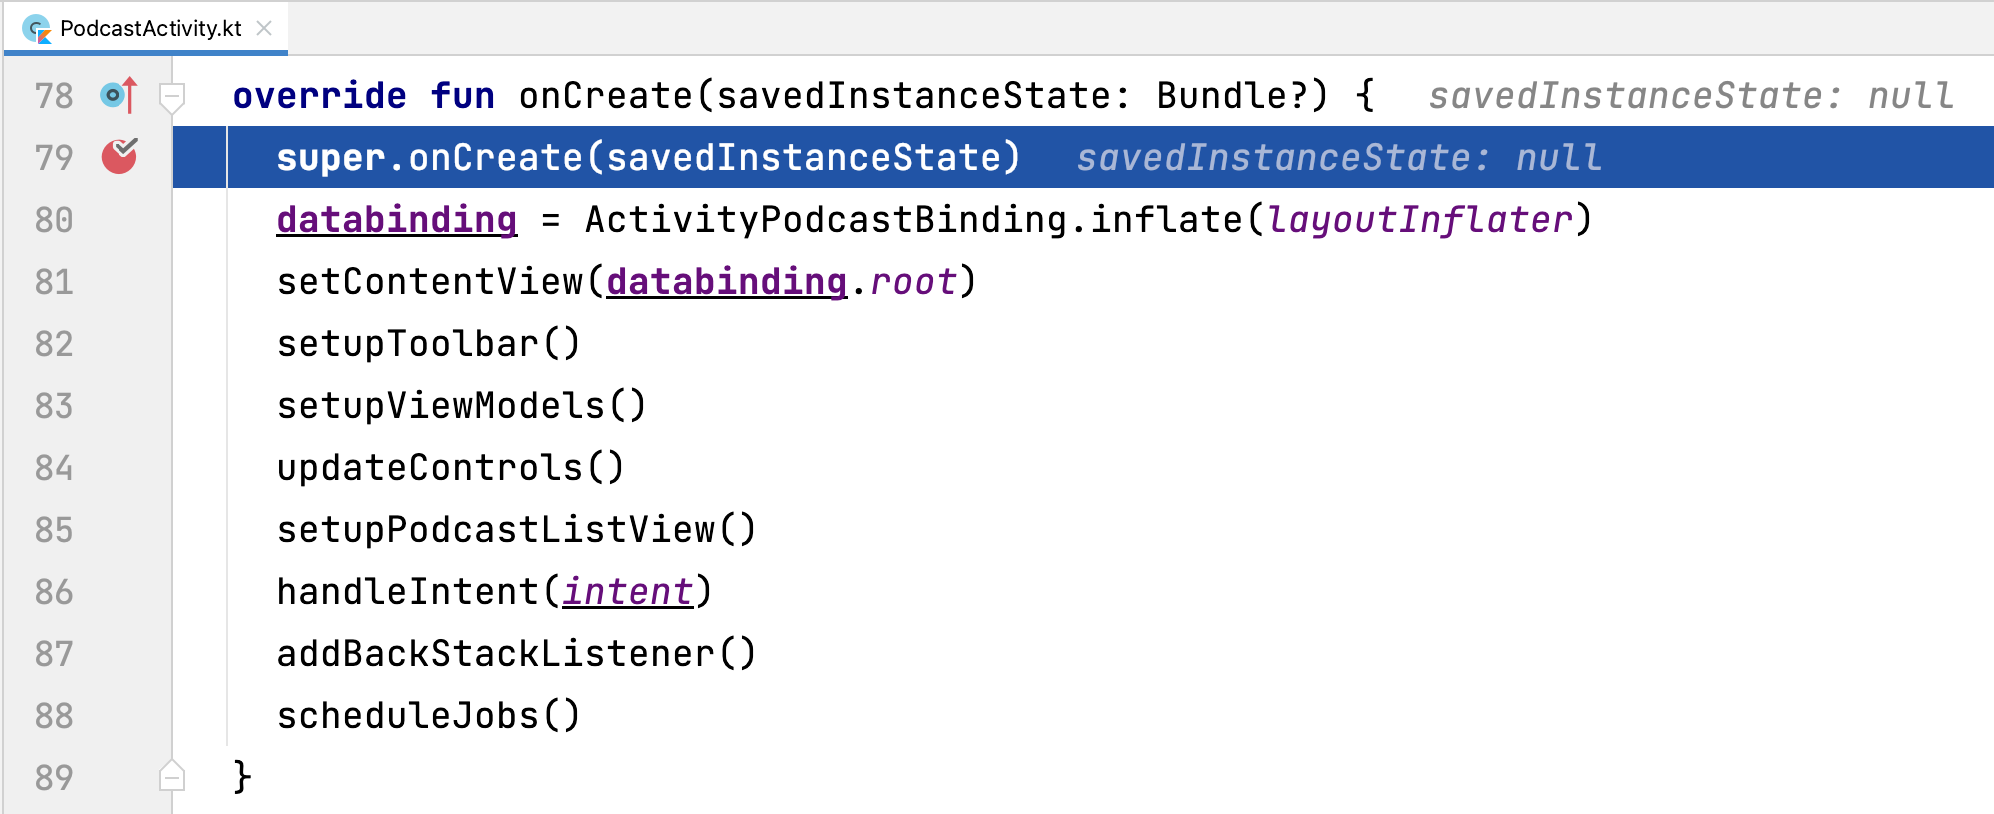
This indicates that the code has paused before executing this specific line. You can’t interact with your app as it’s currently frozen in a suspended state.
Becoming Acquainted With the Debug Window
When your code runs in debug mode, you have access to the Debug Window. This is your command center for debugging; it’s where you can observe your variables, threads and logs. It’s also where you can execute debugging commands such as stepping through your code’s execution line by line after it’s suspended on a breakpoint.
The Debug Window will automatically appear at the bottom of your Android Studio window when a breakpoint is hit, and it’ll look like this by default:
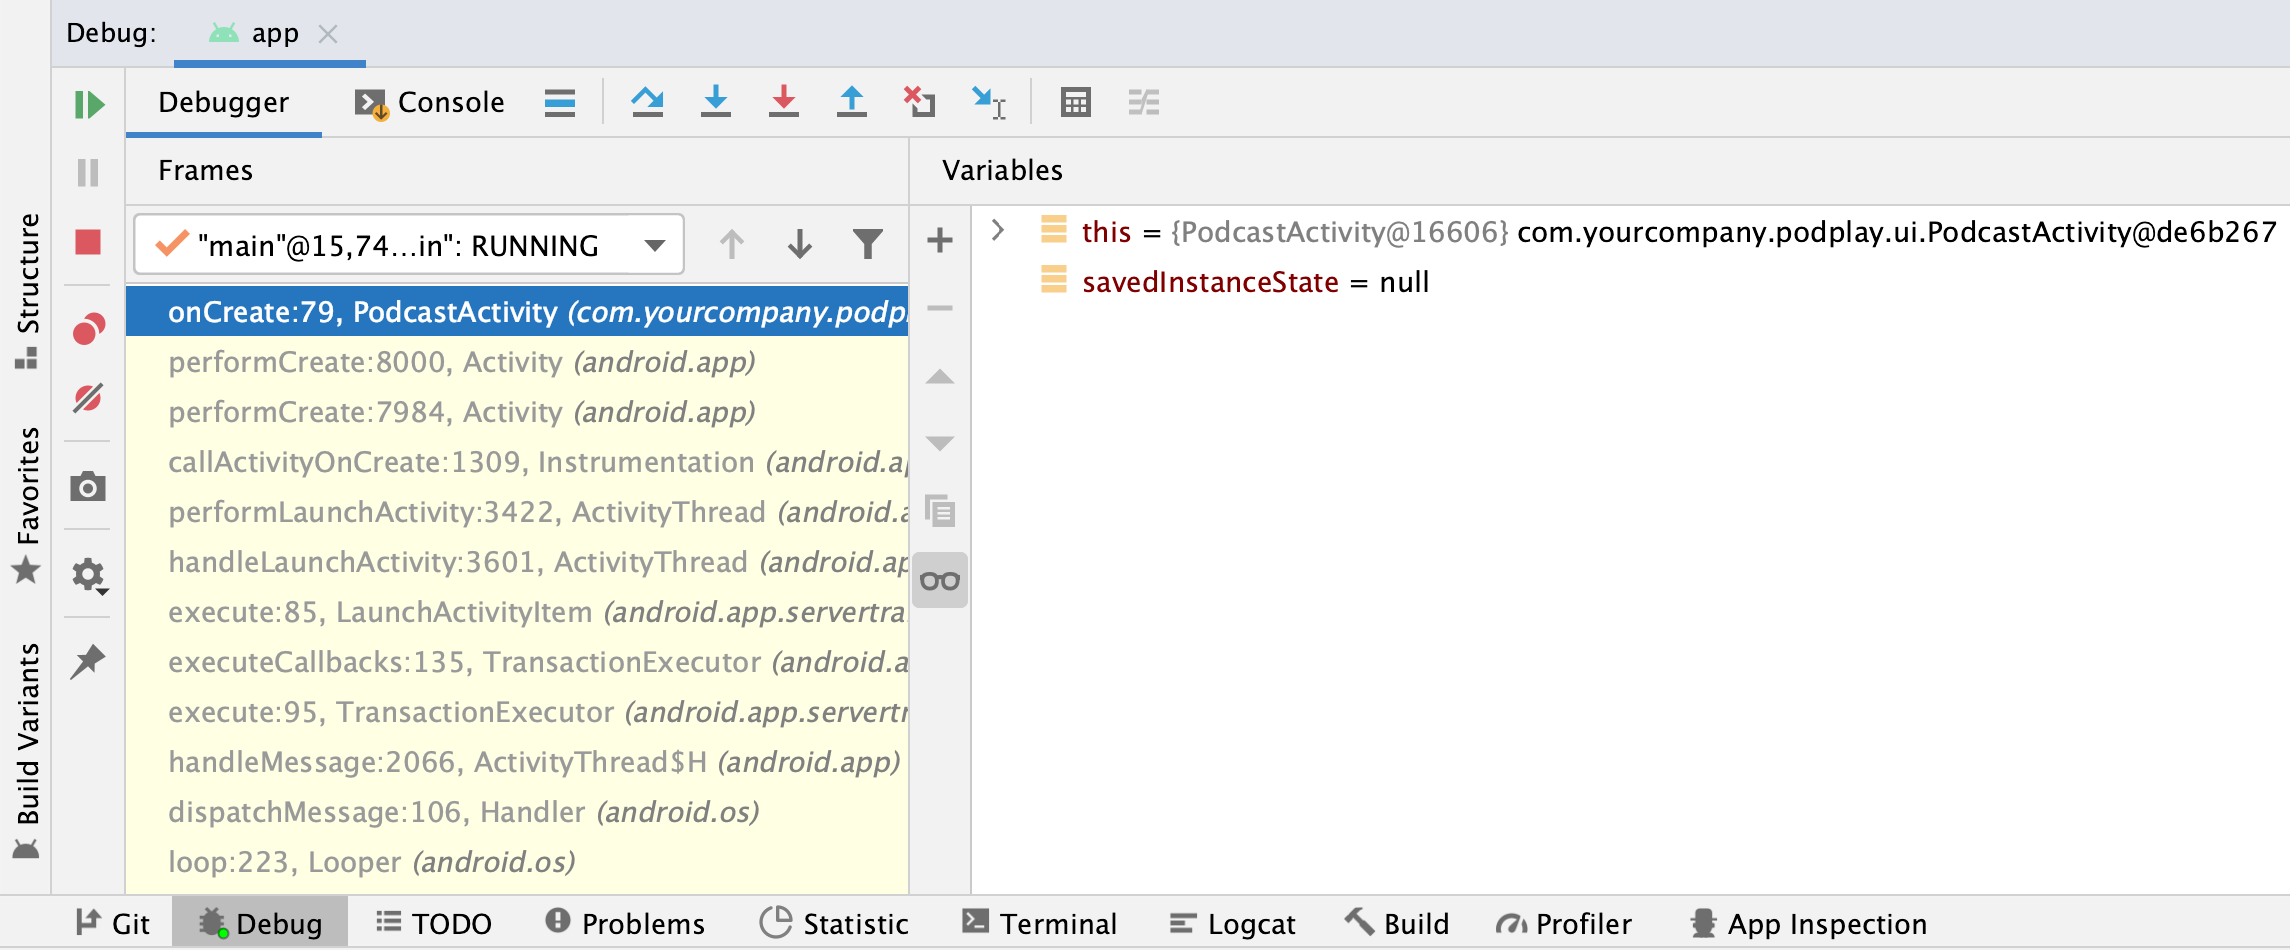
If you don’t see this window, toggle it by going to View ▸ Tools Windows ▸ Debug.

Stepping Through Your Code
You can find code execution buttons at the top of the Debug Window:

Here is what these buttons do:
- Show Execution Point: Clicking this button will focus Android Studio on your current execution point. If you navigate away from your execution point while your program is paused to investigate another class or method, this button will re-orientate you back to your execution line.
- Step Over: This executes the currently highlighted line of code and moves on to the following line within the current method scope.
- Step Into: By clicking this button the debugger steps into the method on the execution line and starts executing its logic along with switching the scope. The Frames pane will open a new stack frame, and your execution line will move into that method. You’ll learn about this in the next section.
- Force Step Into: When running Step Into, Android Studio will usually only do so when the function that you’re stepping into is your own code. Force Step Into will tell Android Studio to step into the method no matter what, even if the source code can’t be fully indexed. You can learn more about indexing at https://www.jetbrains.com/help/idea/indexing.html.
- Step Out: This will do the opposite of Step Into. The debugger steps out of the current scope, moving one level higher.
- Drop Frame: Similar to Step Out, although you’ll return to the code line before the frame began instead of after the frame has completed execution, effectively time traveling back in your program.
- Run to Cursor: This will resume executing the program until it reaches the line of code wherever your cursor is placed (as if there was a breakpoint on that line).
On the left of the Debug Window, you have:
- Play: Resumes executing your program until it reaches the next breakpoint.
- Stop: Stops debugging your app.
Next, to put these buttons into practice, you’ll navigate your code using them.
In the previous step, you entered debug mode with your code execution paused on the super.onCreate(savedInstanceState) line inside onCreate(); if you’re not in debug mode, go to the AS toolbar, click the Debug button again and get back to that breakpoint.
Click Step Over four times. Your code execution line moves down within the onCreate scope and ends up on line 5 of the function: setupViewModels().
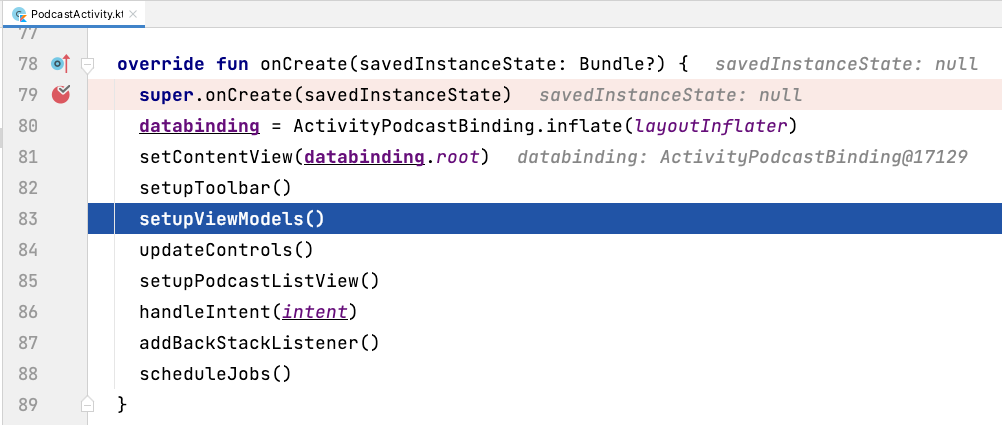
Now, step into the highlighted method by clicking Step Into. Your code execution moves to the first execution line of setupViewModels(), like so:

Use the Step Out button and you’ll end up back inside the onCreate scope after setupViewModels() has executed.
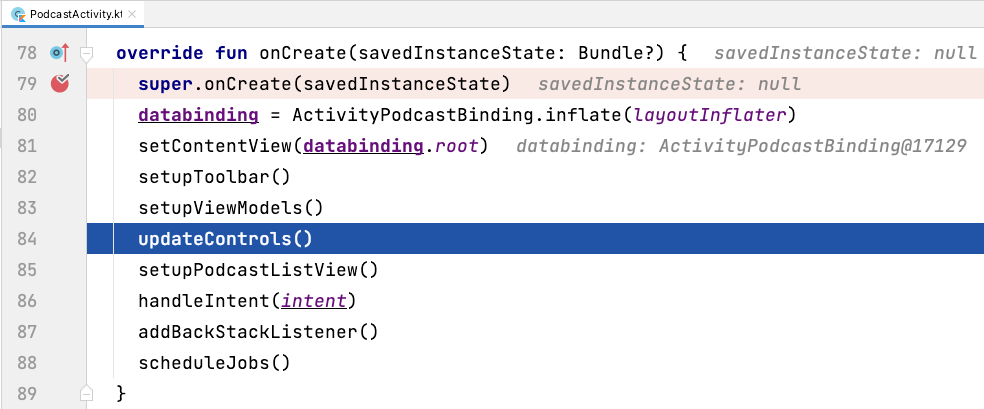
Now, go to the line of code that calls handleIntent(intent) inside onCreate() and click so that your cursor is at the end of that line:

Click Run to Cursor, and your execution will resume until it reaches that line. This is a handy button to use if you want to quickly navigate to a line of code without setting a breakpoint there.
Great job! You’ve learned the basics of code navigation in debug mode. Click Stop to stop your debug session.
Next, you’ll learn how about stack frames and how to drop them.
Navigating Stack Frames While Debugging
Remove your breakpoint from onCreate() inside PodcastActivity by clicking the breakpoint circle; you no longer want your code to pause execution on that line.
Relaunch the app by clicking Play and subscribe to two podcasts so that they appear on the home screen of your app. Do this by tapping the search icon in the app bar, entering a phrase such as “science” and pressing the Return key on your keyboard to start searching for results:
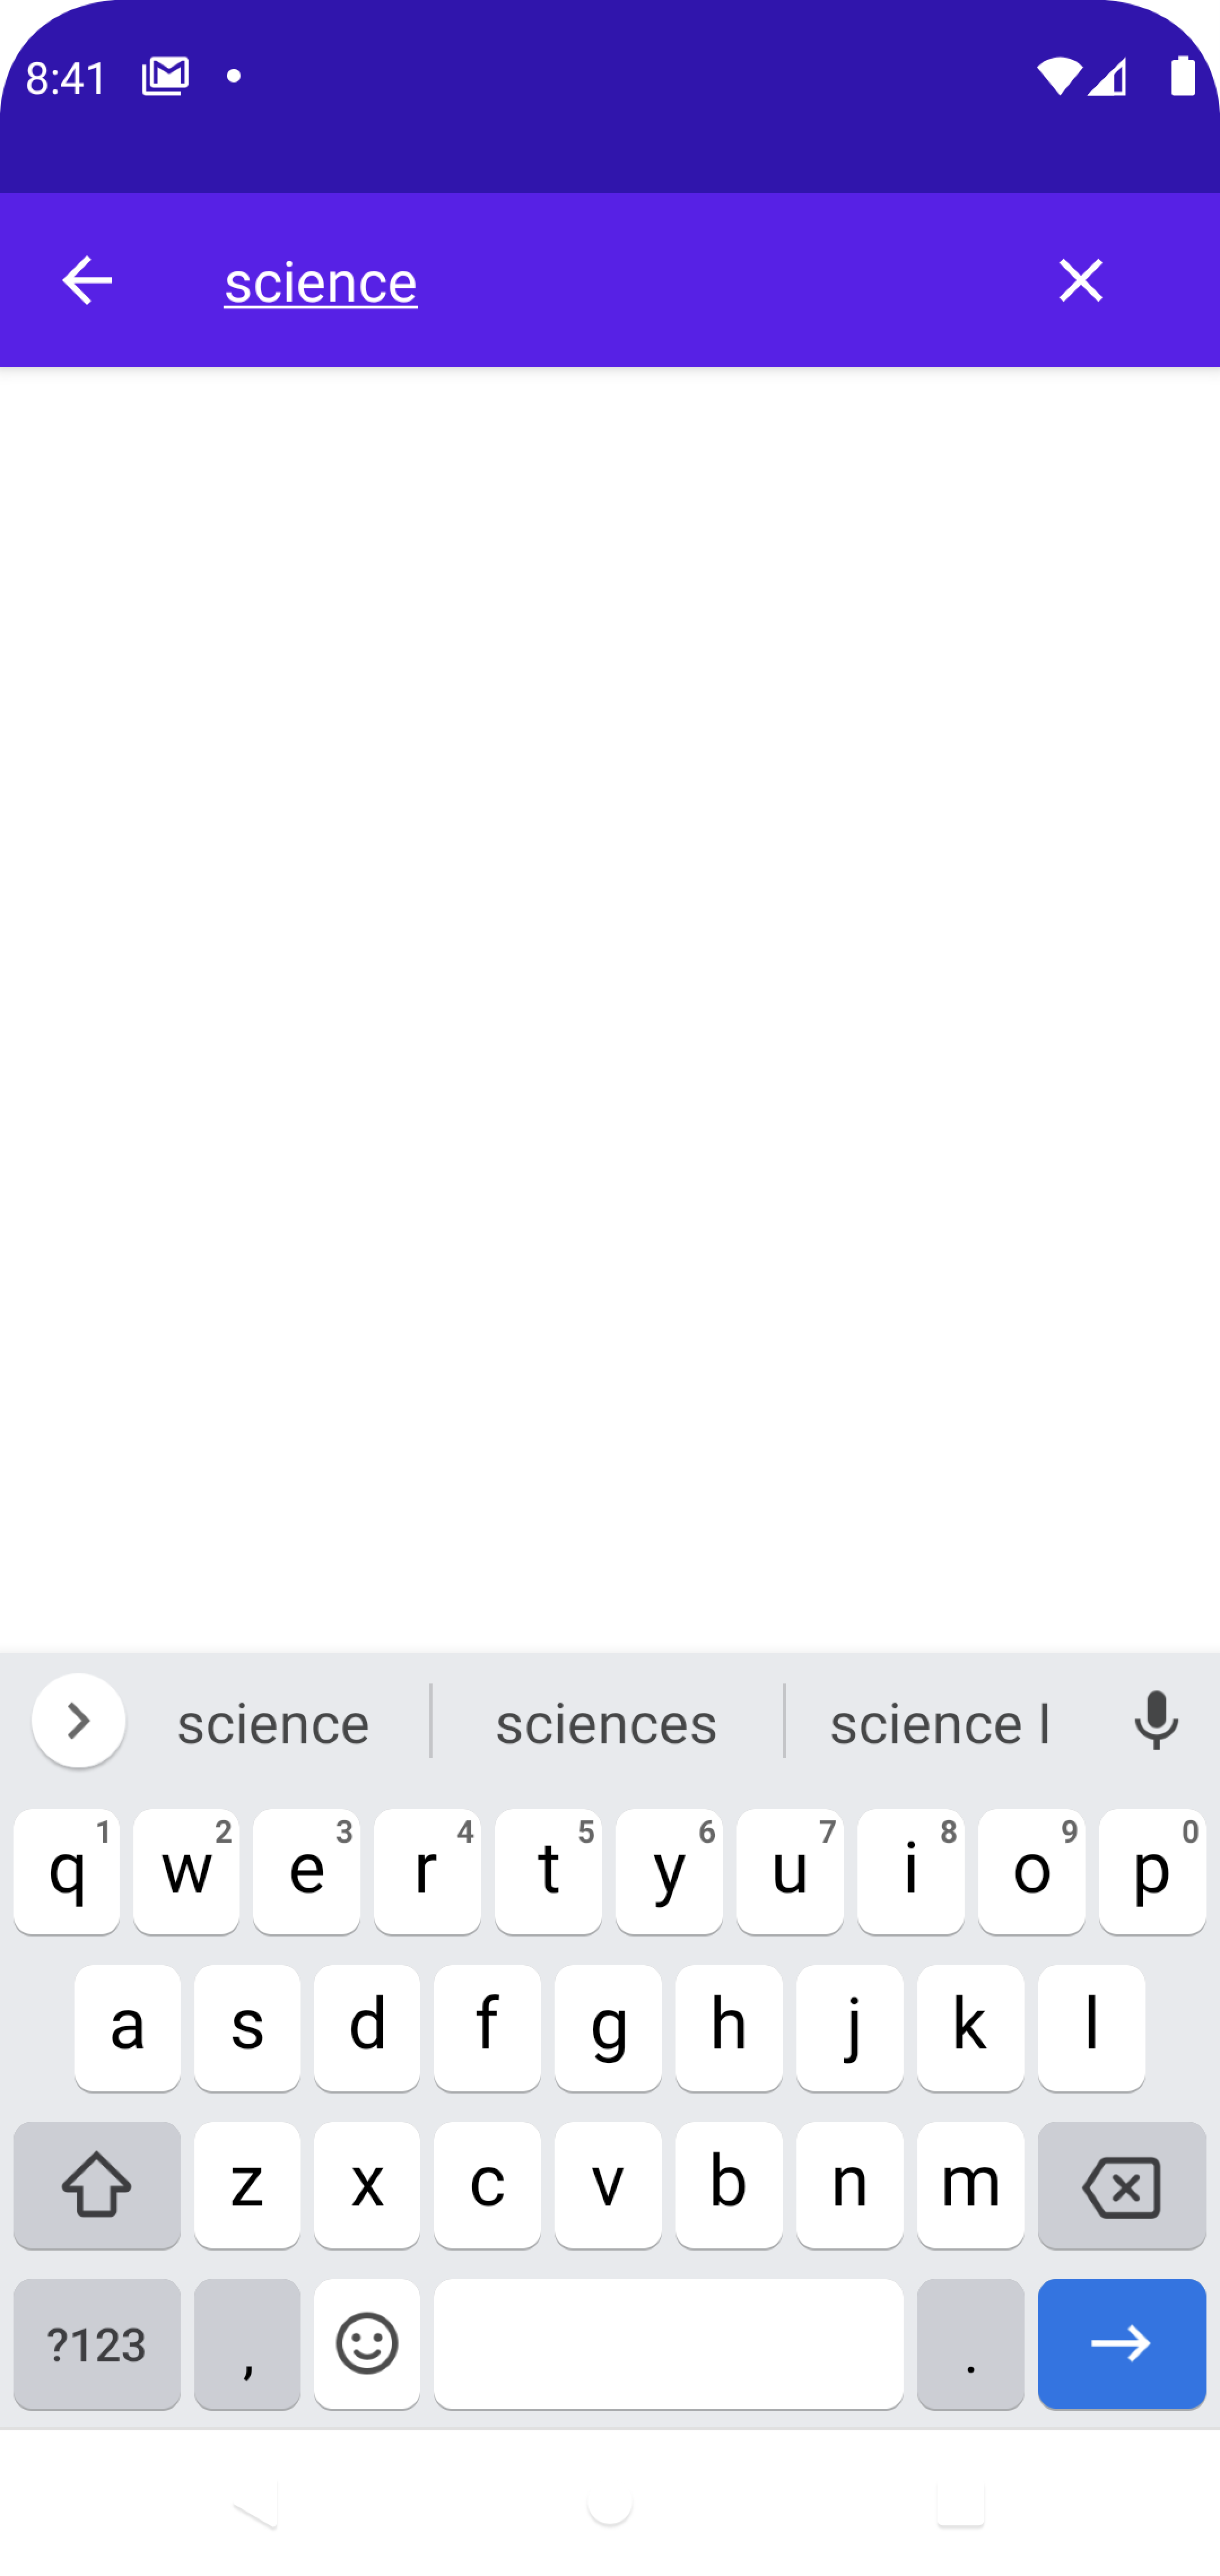
Now, tap a podcast within the list of results.
Then, tap SUBSCRIBE at the top right corner of the screen:
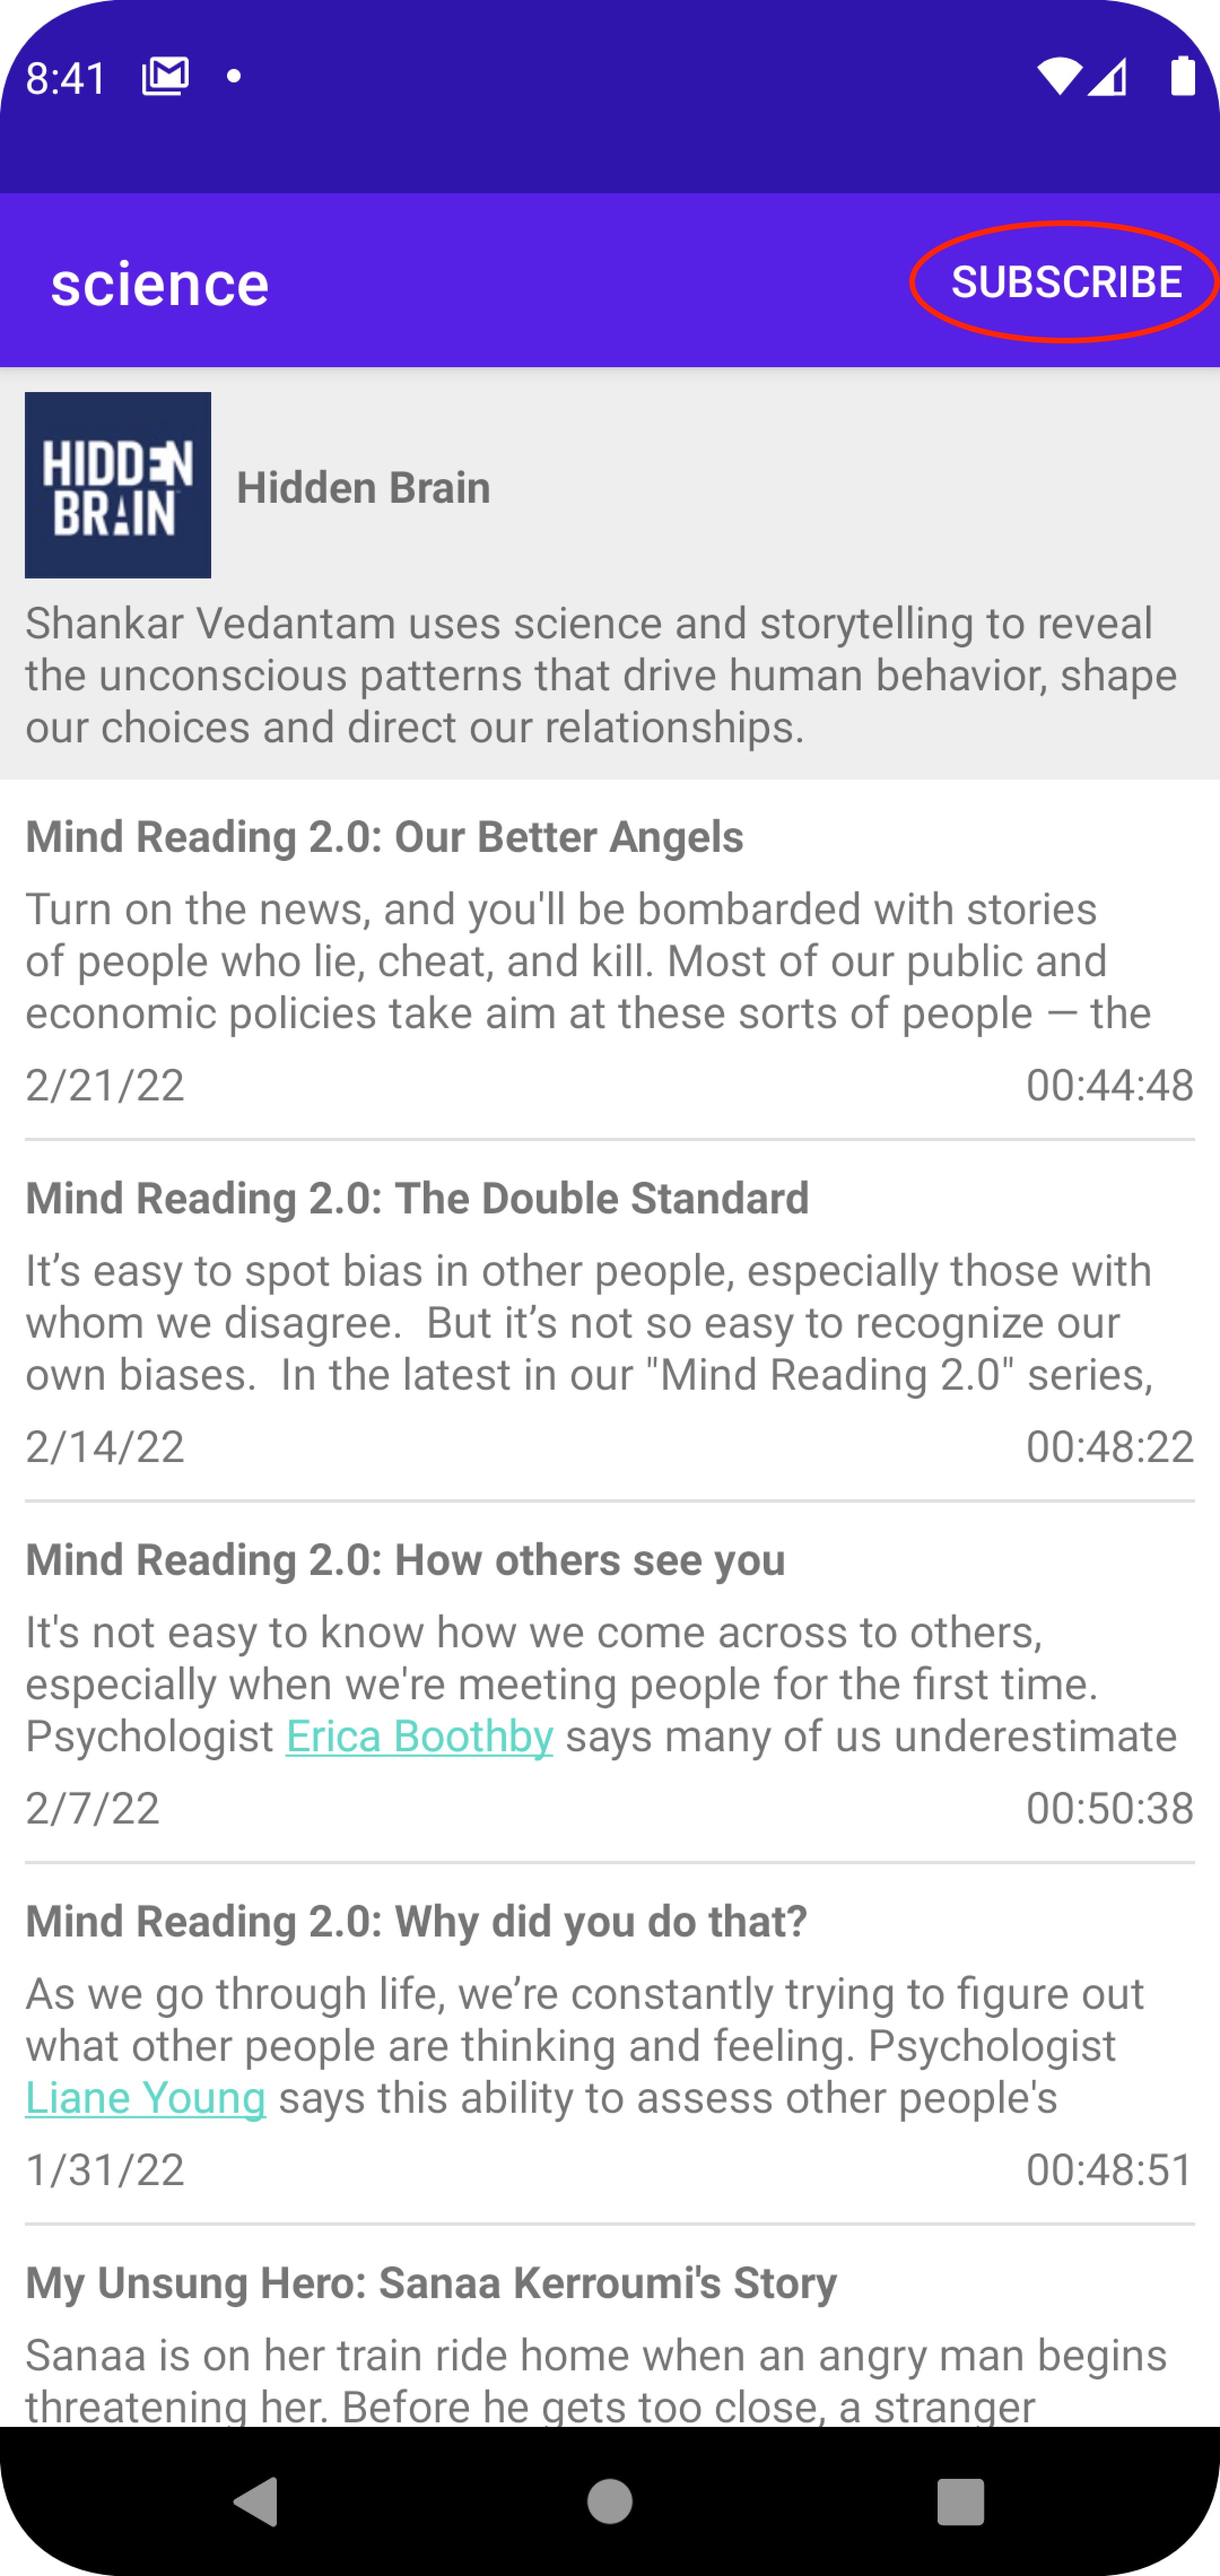
Do this two or more times until you have a selection of subscribed podcasts in your home screen view:
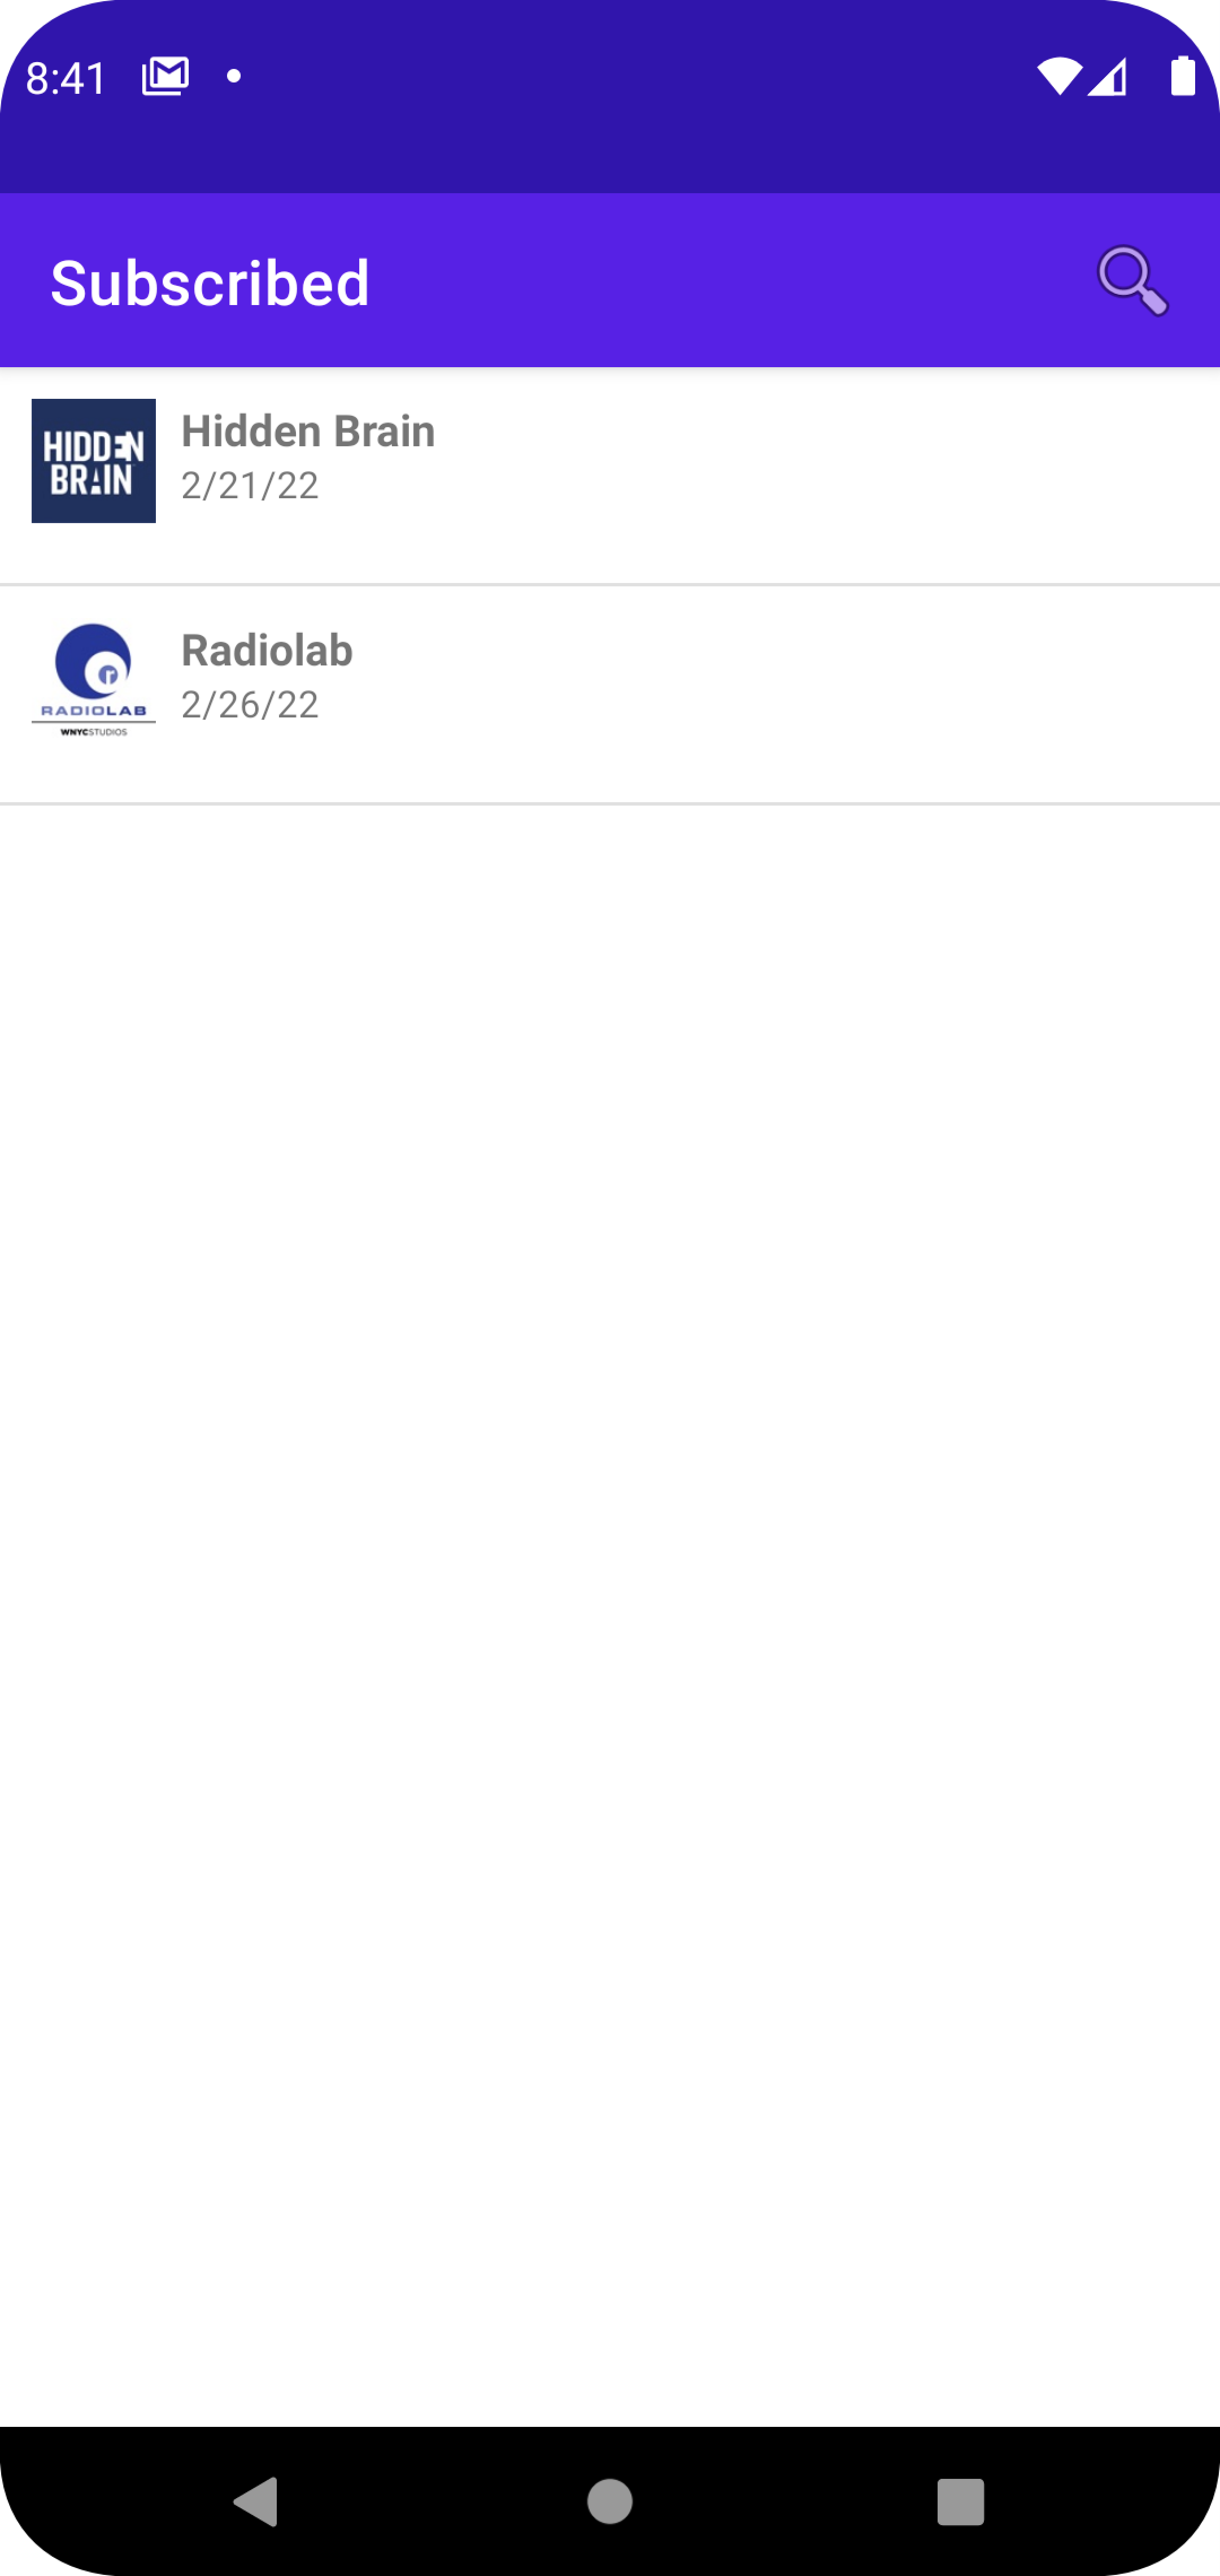
Now, back in Android Studio, further down, inside PodcastActivity find showSubscribedPodcasts(); place a breakpoint on the first line inside this method’s scope where the code is calling getPodcasts() from podcastViewModel.
Run your app in debug mode and your code execution will pause on that line:

Now, bring your attention to the Frames pane inside the Debug Window:
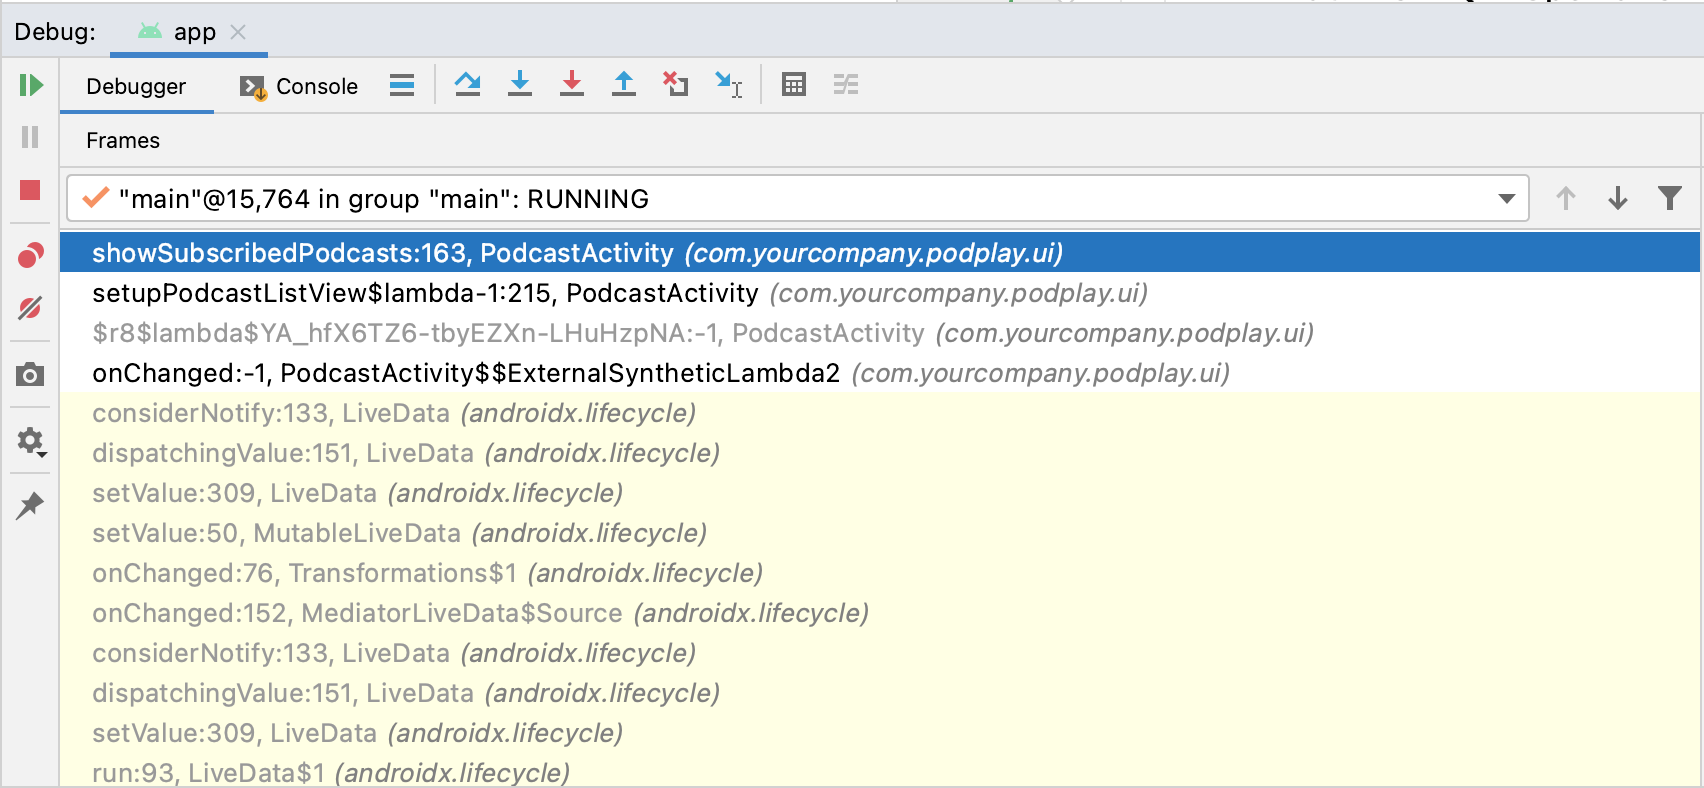
Each frame is a list item that represents the scope of a method. The frame you’re viewing is highlighted in blue; right now, it’s the frame of showSubscribedPodcasts(); the scope where your code execution has paused at your breakpoint.
Frame list items show useful information that dictates where it’s located:

Here is a breakdown:
- showSubscribedPodcasts: The scope in which the frame is located.
- 163: The code line number where the code execution is paused within that frame.
- PodcastActivity: The code’s class.
On the right of the Frames pane, you’ll see the Variables pane. This pane shows the visible variables available to the current frame.
Click the chevron next to this in the Variables pane to see a list of all of the variables and values available to the frame’s context.
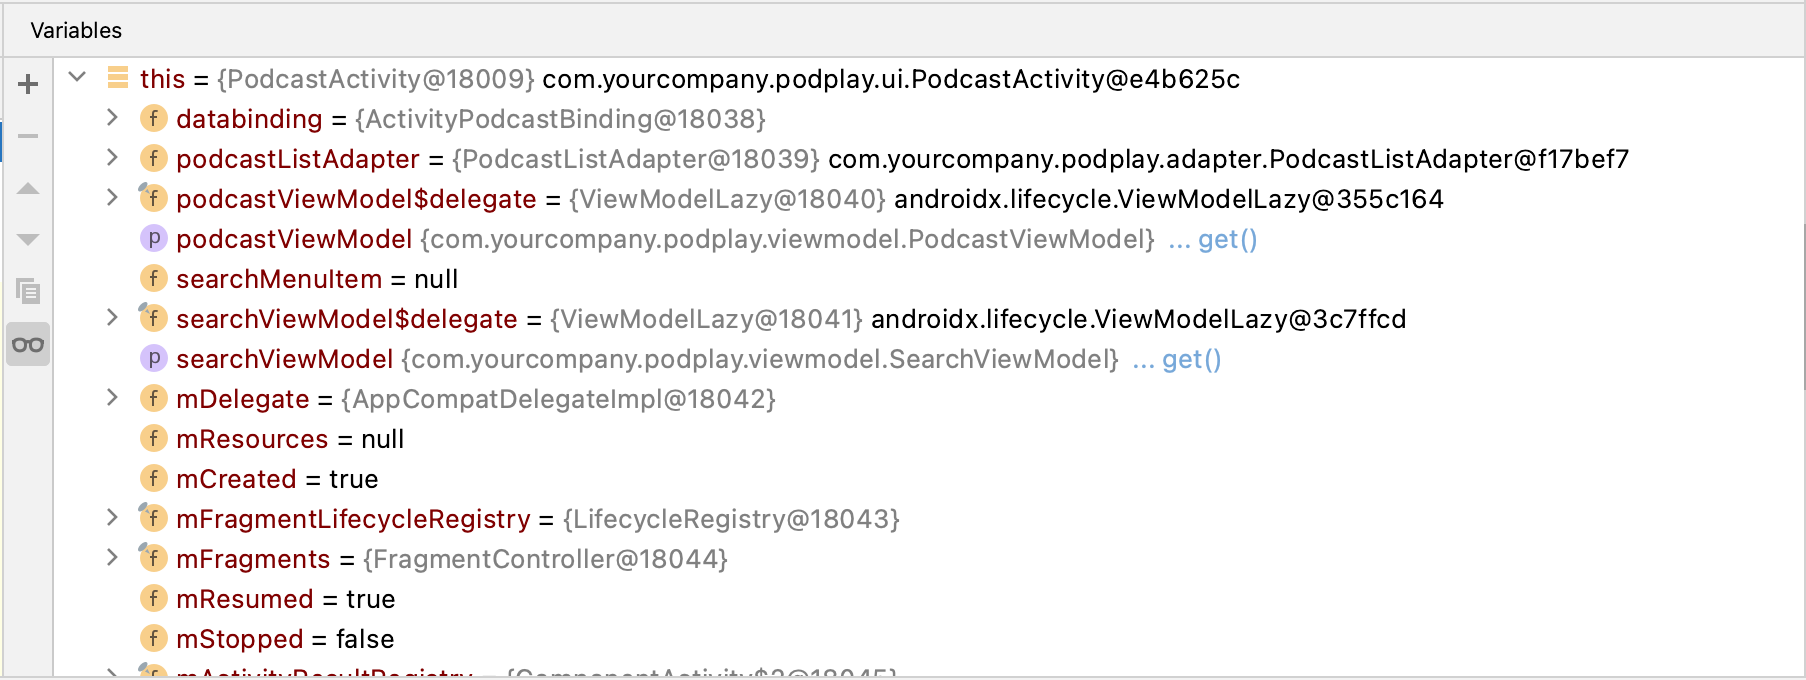
Click Step Over to execute your currently suspended line of code.
Your code moves down the scope, executing getPodcasts() from the view model. Now your Variables pane shows a podcasts variable which is only visible to the active scope of showSubscribedPodcasts(). Expanding the list using the chevron again will show you the podcasts that you subscribed to earlier:

Imagine for a second that you accidentally clicked Step Over and you wanted to debug getPodcasts(); by stepping over, you’ve executed that method without going into the scope via Step Into.
There is still a way to step into getPodcasts() without restarting the app by using the Drop Frame feature.
Using Drop Frame to Travel Back in Time
Drop Frame does precisely what the name dictates. It drops the current frame and reverts the code execution to the previous one.
Look at the Frames pane and notice that the previous frame in the stack is a frame with the setupPodcastListView’s scope. Click that frame and focus on it to expand the frame box:
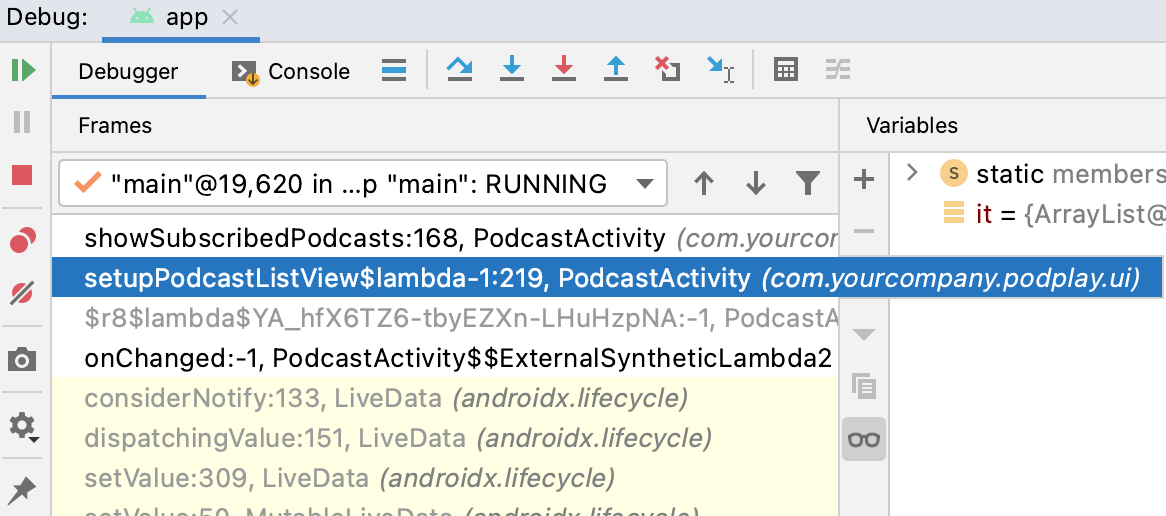
Notice it holds information about where the first call of showSubscribedPodcasts() was.
As you learned earlier in this chapter, the Drop Frame action stands next to the Step Out action. Now, use Drop Frame and click Step Over once.
Magic!
You’ve traveled back in time in your program’s execution to the first line of showSubscribedPodcasts().
The Drop Frame button can save a lot of time when debugging as, in most use cases, it means that you don’t have to restart your app.
The way it works is by caching each of the frames so that they can be reloaded when required. When using this feature, bear in mind that if you were in the middle of a long function that had done a lot of intermediate work, for example, modifying the state of the current class, that wouldn’t get undone when you drop the frame; so use Drop Frame with that caveat in mind!
Conditional Breakpoints
Until this point, you’ve learned how to mark a code line with a default suspend breakpoint that simply pauses your code execution when it’s hit.
Now, you’ll look at some more advanced features of breakpoints; features that let you control when the breakpoint is hit and what it should do when that happens.
You’ll need some more tricky code to debug for this section. Remove your existing breakpoints and stop your code from executing by clicking Stop.
Open PodcastListAdapter.kt and scroll down until you get to onBindViewHolder(). Place a breakpoint on the first line of code within that function:

Right now, you want to debug the logic of PodcastListAdapter when the user searches for podcasts.
Run your app in debug mode and wait for your program to reach the breakpoint.
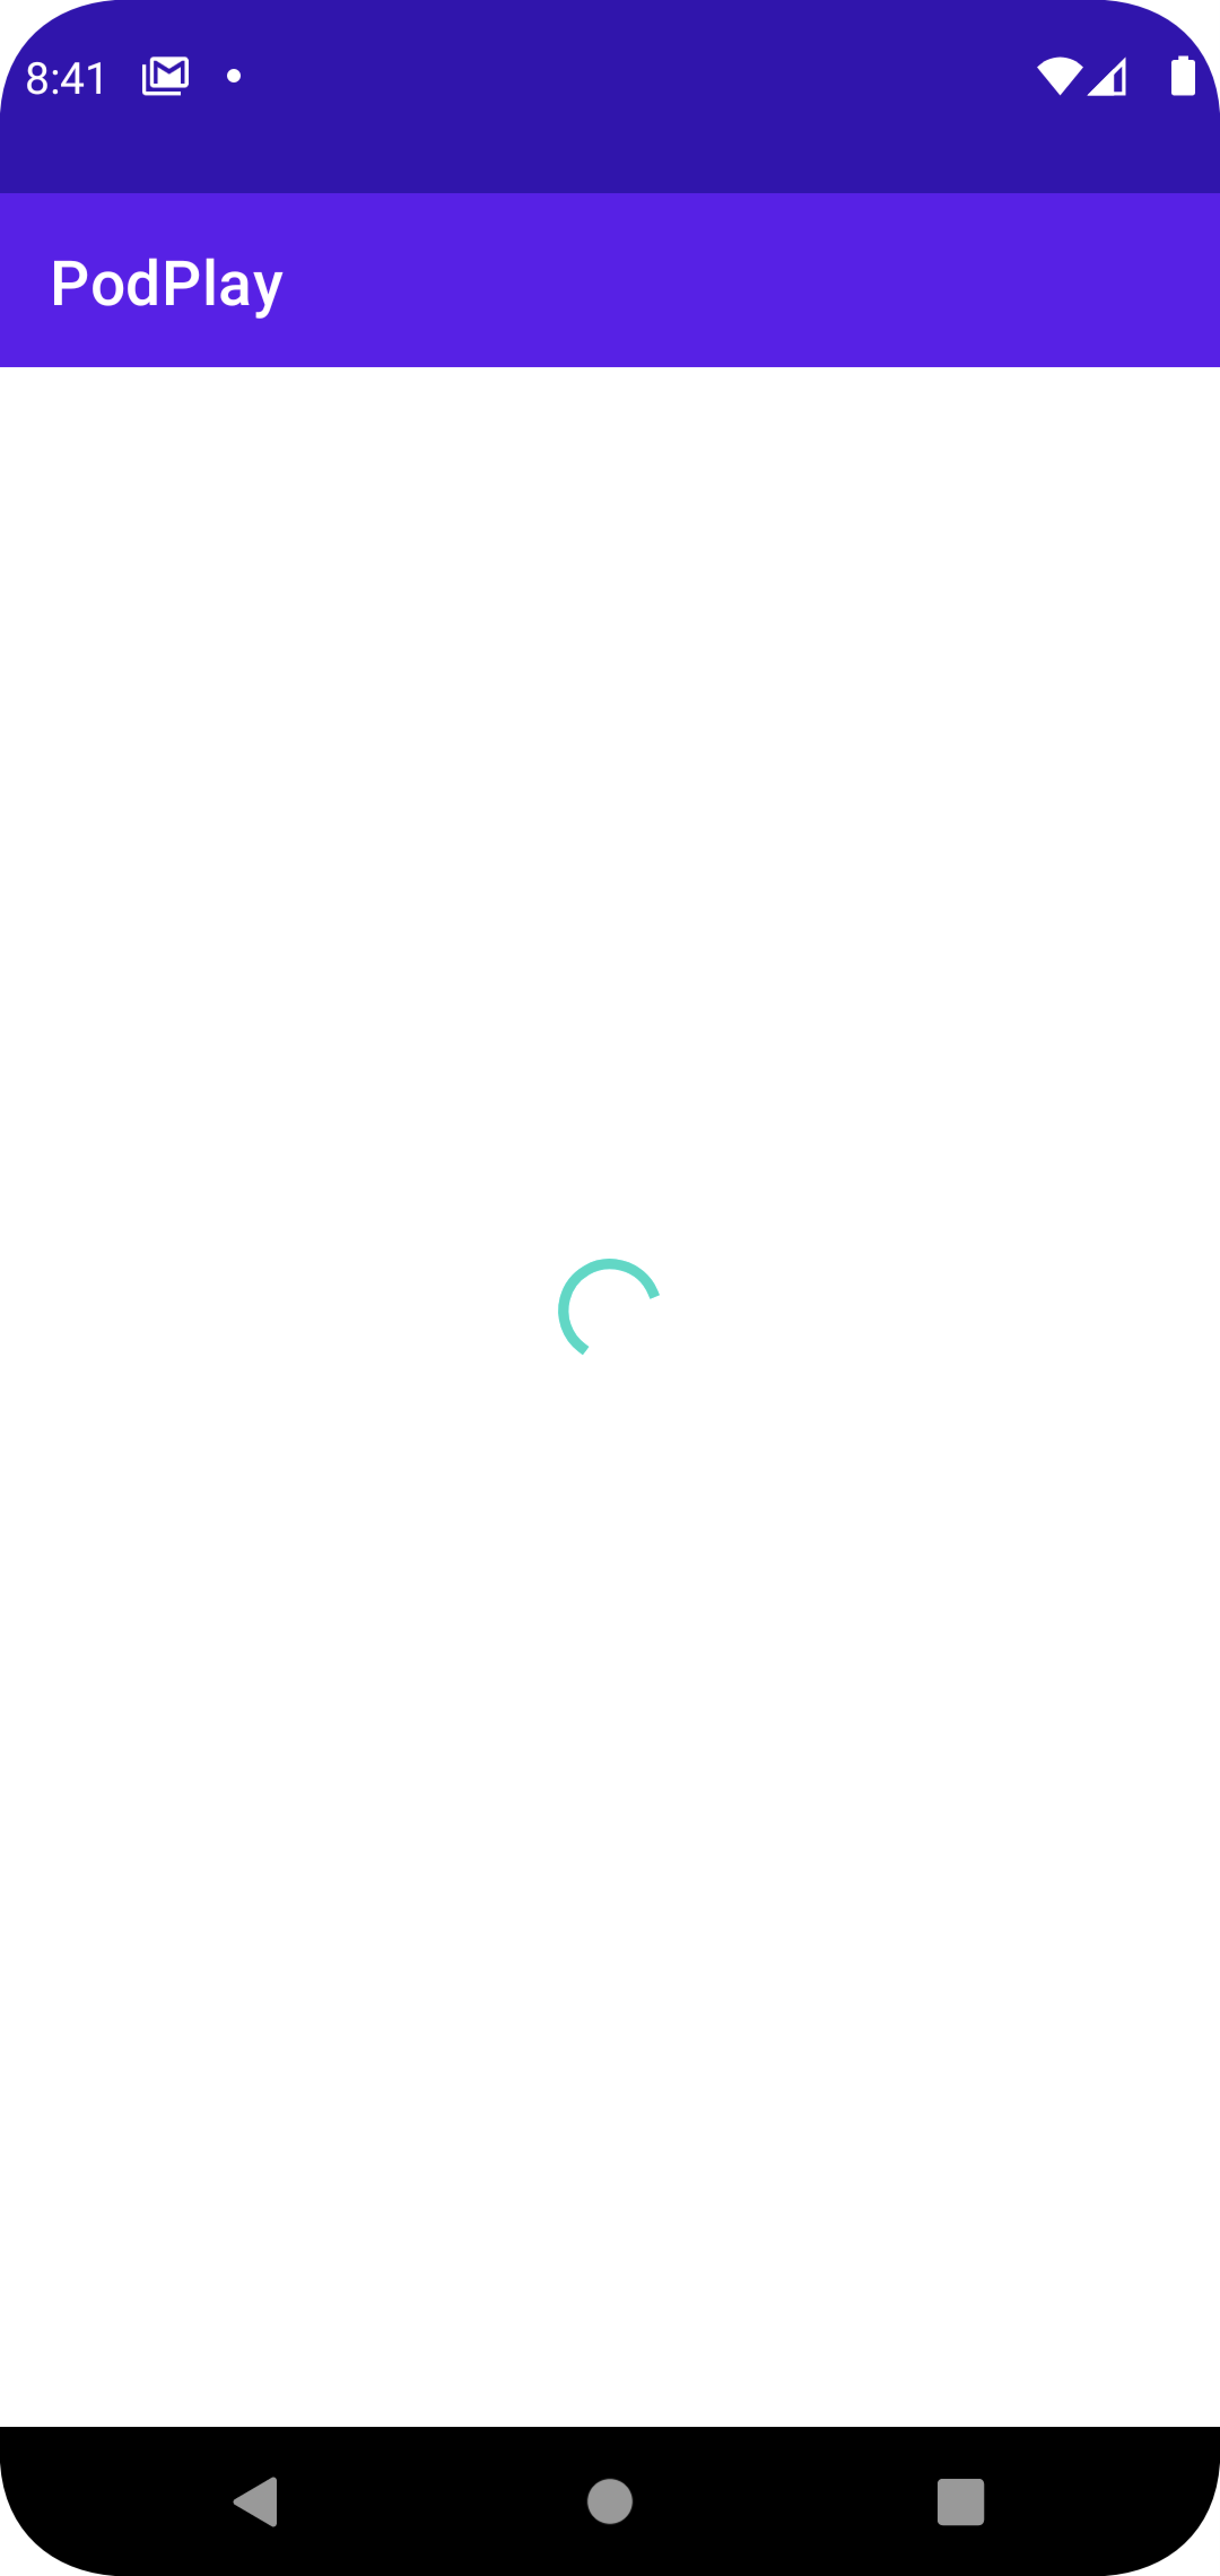
Something has gone wrong!
The code shouldn’t have paused here; you haven’t entered a search term yet. You might be wondering what is going on.
What happened is that the PodcastListAdapter is being used in two places; the first is for displaying the user’s list of subscribed podcasts, and the second is for showing the podcast results of a search term.
This is quite a common use case in development; reusing code is actually encouraged. So, how do you ensure that you’re debugging the correct adapter? With conditional breakpoints, of course!
Dependent Breakpoints
To solve the problem of code reuse, you can use a condition called breakpoint dependency. This is where we can set up a breakpoint only to be enabled if a previous, different breakpoint has been hit.
Go back to PodcastActivity.kt, scroll down until you find performSearch().
Note: if you aren’t a fan of scrolling through large classes like this one, you can press Shift twice to search for terms in your project. Just type the method name in the search box to save yourself some time.
This method updates the PodcastListAdapter with podcast search results with this line of code:
podcastListAdapter.setSearchData(results)
This is a perfect example of a notifier for suspending on PodcastListAdapter. If the system executes it, you know that the user has input a search term and the adapter is about to be repopulated.
Place a breakpoint here. You don’t want the code execution to actually pause on this line of code, so here is where you’ll use a new type of breakpoint: An unsuspended breakpoint.
An unsuspended breakpoint won’t pause your code execution when hit; this can be used for many practical use cases, one of them being logging, which you’ll get to later. For now, you’ll simply use this as a trigger for enabling your other dependent breakpoint.
To use this type of breakpoint, right-click it and select More at the bottom of the breakpoint window:

This will open up a lot more settings for your breakpoint. For now, uncheck the box that says Suspend:
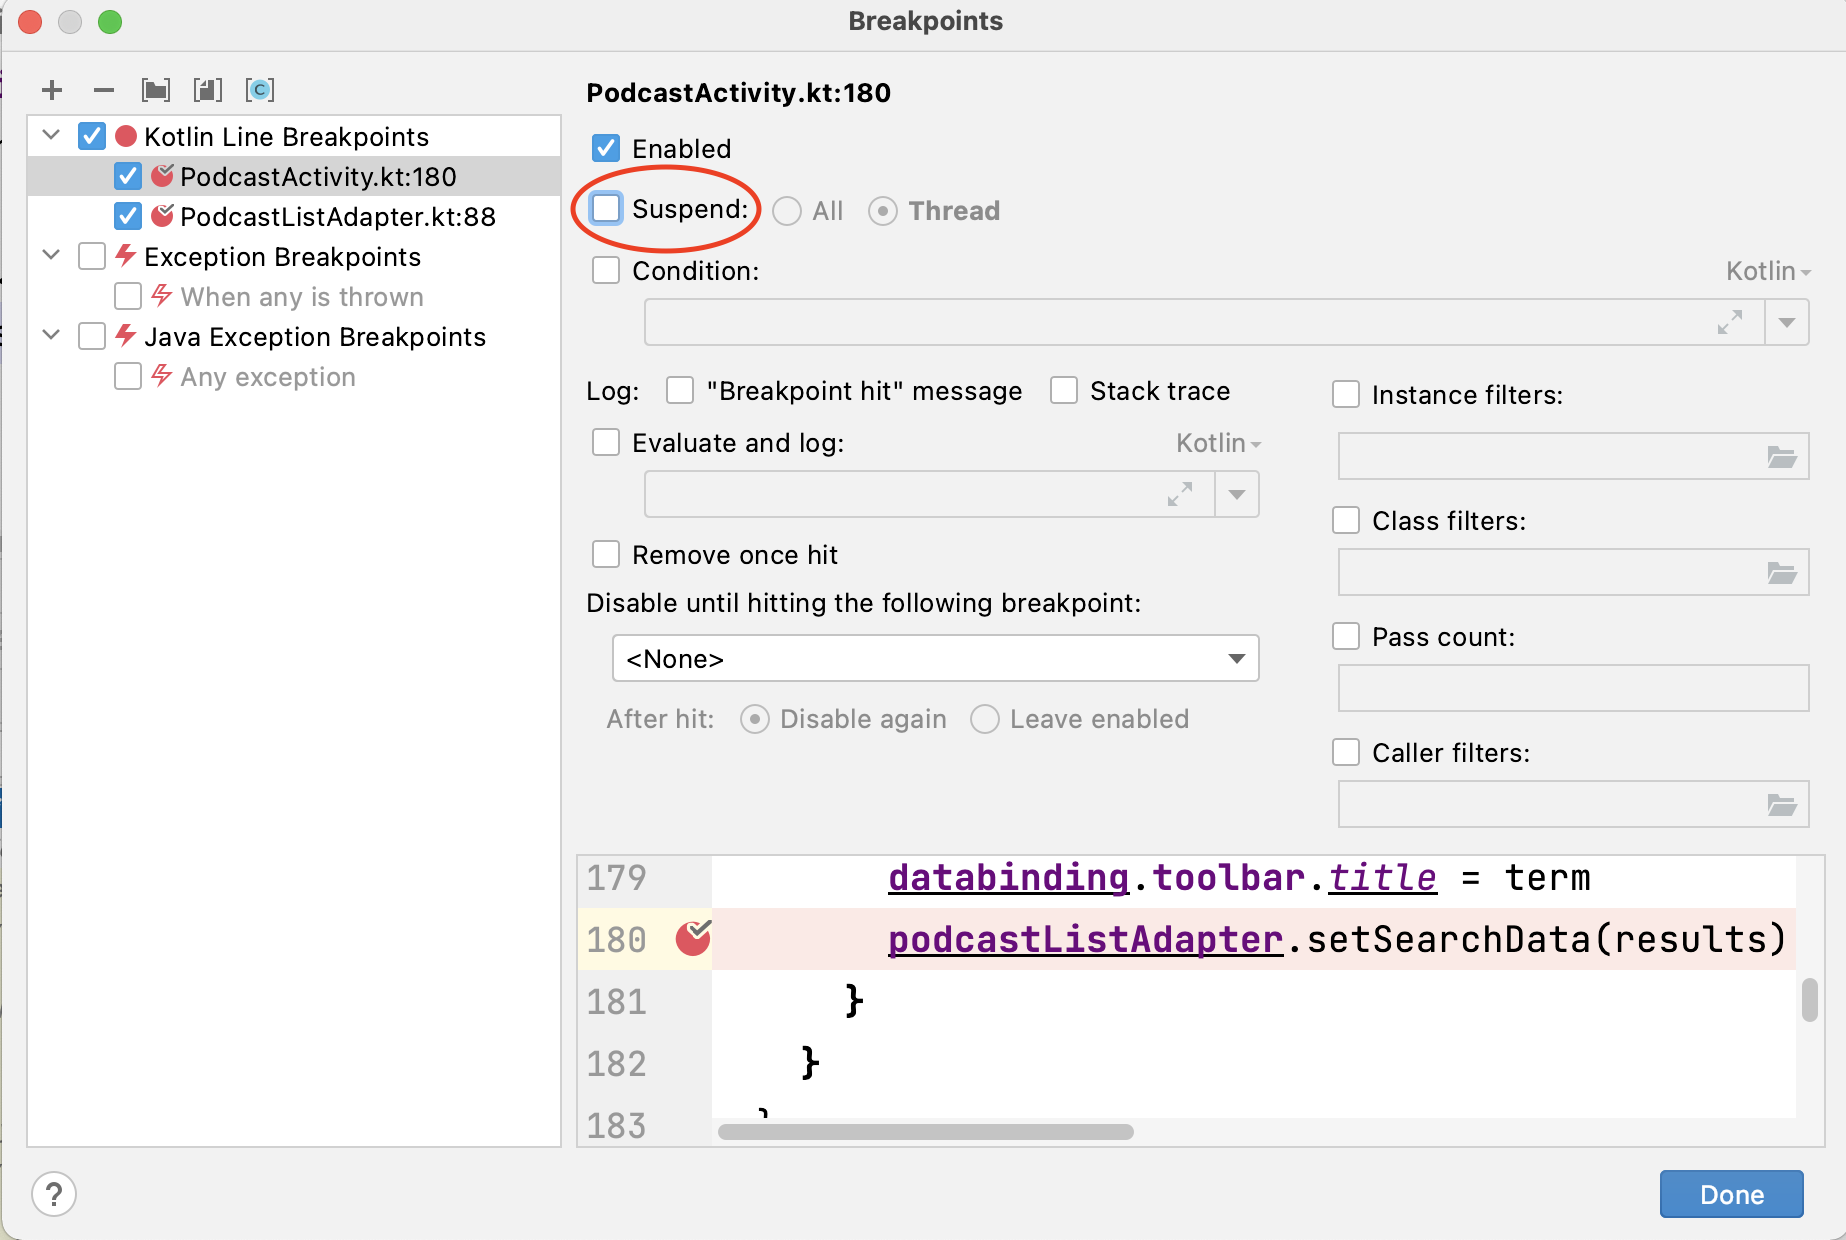
Click Done. Your breakpoint is now an unsuspended breakpoint; it’s turned from red to orange to indicate this.
Note: A nice shortcut for placing an unsuspended breakpoint is to press Shift-click instead of just clicking next to a line of code.
Next, open PodcastListAdapter.kt again and go to your breakpoint in onBindViewHolder().
Open the settings of this breakpoint by right-clicking it and clicking More.
In the dropdown underneath “Disable until hitting the following breakpoint:”, select your PodcastActivity unsuspended breakpoint.
Click Done to close the Breakpoints window.

Your onBindViewHolder breakpoint will now have a red border:

This indicates that it’s currently not enabled. It’ll become enabled and, in turn, switch to solid red when the debugger reaches the dependent breakpoint in PodcastActivity.
Rerun your project in debug mode. Now, when you launch the app, your code won’t stop executing.
Start searching by tapping the search icon in the app bar and inserting a podcast name. After you confirm the search term, your execution will break successfully:

Code Conditional Breakpoints
Breakpoints can be configured to suspend code only if a specific code condition is met. This is useful if you’re trying to find a bug that only appears under certain conditions.
To demonstrate this function, go back to your onBindViewHolder dependent breakpoint in PodcastListAdapter.kt. Move it down two lines by clicking and dragging it from its current line:

You set the new position after the summaryItem variable has been populated, so you’ll be able to use that data in a breakpoint code condition.
Open the settings of your breakpoint by right-clicking it and then clicking More.
Check the box that says Condition: and in the input label underneath, type in this code:
summaryItem.name == "Android Developers Backstage"
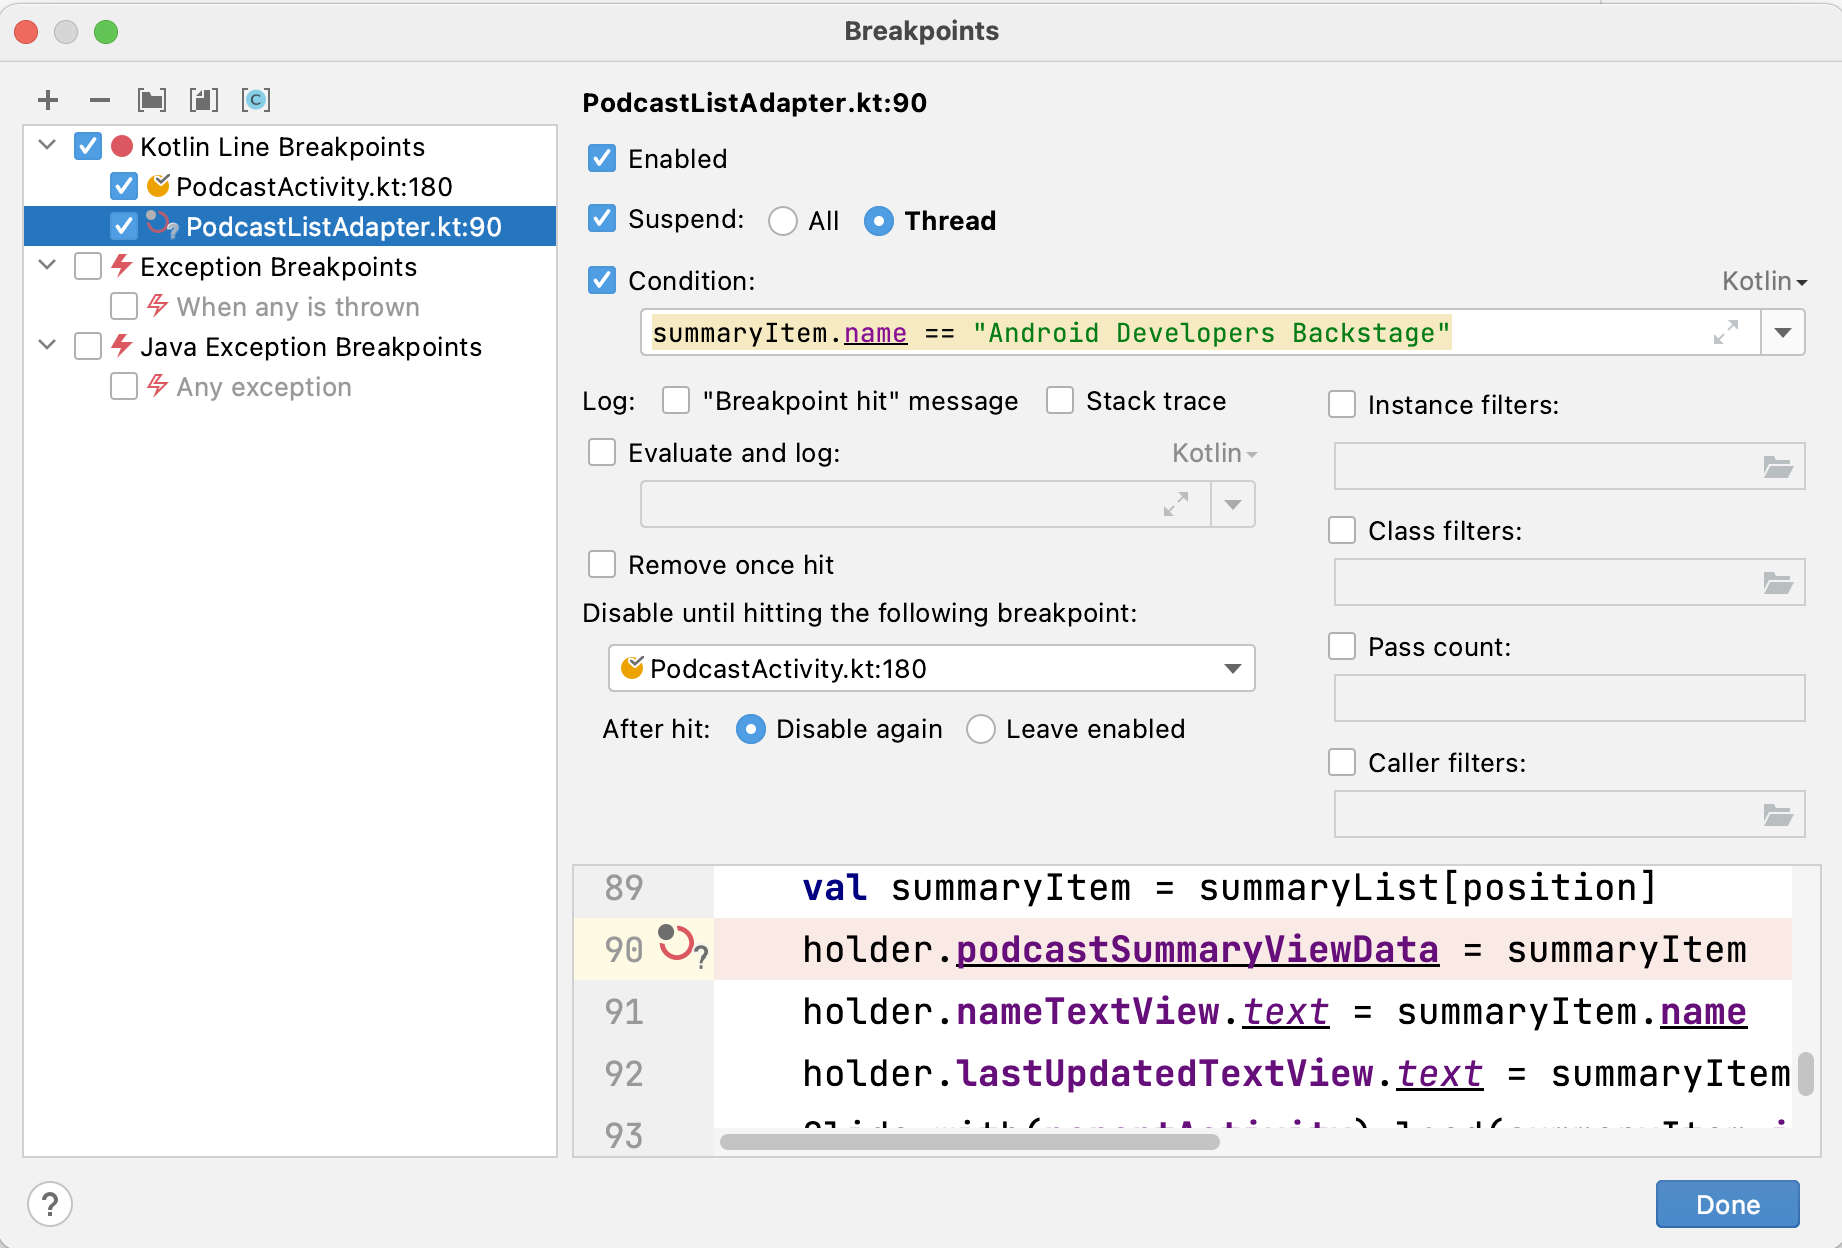
Click Done and then resume debugging by clicking Play.
Now, your code won’t suspend unless both the dependent breakpoint and code conditions are met. So it should only suspend if you are in the search view and a podcast whose name equals Android Developers Backstage is being populated by the adapter.
Try searching a few search terms to verify that the app code does not pause execution; then input “Android” into the search field.
Your code suspends as the adapter is attempting to populate the list item for the podcast Android Developers Backstage:

When debugging adapters with many results, a code conditional breakpoint such as this can save a lot of time!
Breakpoints Window
Most engineers set and remove breakpoints as they need them, but a better way is to manage a more extensive set of breakpoints using the Breakpoints window.
You can access the Breakpoints window in three ways:
-
Using Android Studio Toolbar - You can the Breakpoints window by clicking Run ▸ View Breakpoints….
-
Right-clicking an existing breakpoint to access its settings and selecting More.
-
Clicking View Breakpoints… from the Debug window:
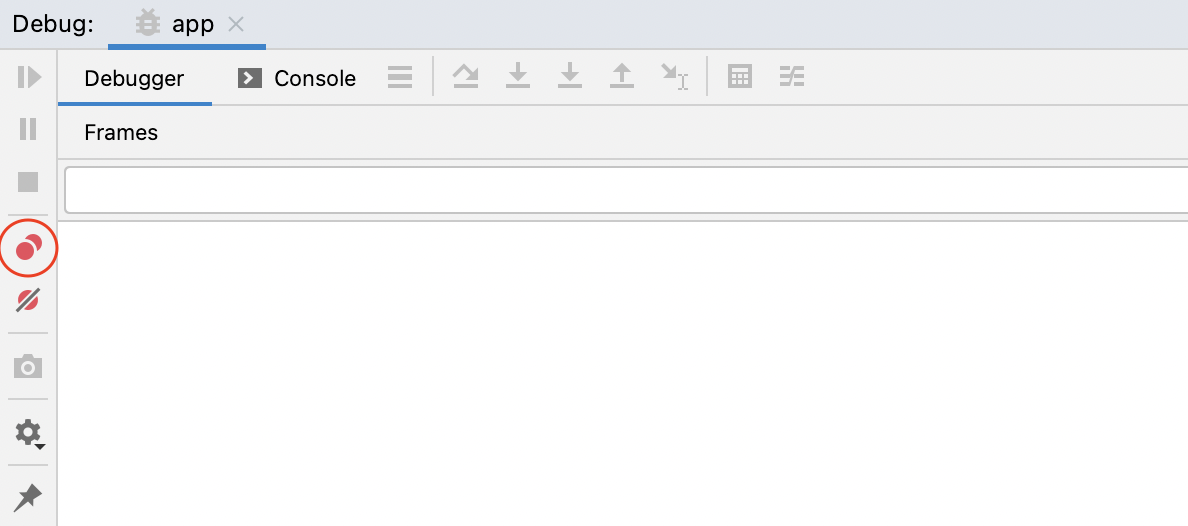
The Breakpoints window is a hub for all of your programs breakpoints; you can go to any that you have set, update conditions and enable or disable them all from this window.

Within the Breakpoints window, you can create groups to store a certain set of breakpoints. These groups can then be disabled and enabled when required.
As a scenario, pretend that the Android Developers Backstage podcast had a bug that you were trying to find and fix. A group would be ideal for storing all of the breakpoints related to this bug.
Open the Breakpoints window by selecting Run ▸ View Breakpoints.
Shift-click on both your PodcastListAdapter and PodcastActivity breakpoints to highlight them both. Then, right-click them and select Move to Group ▸ Create New….
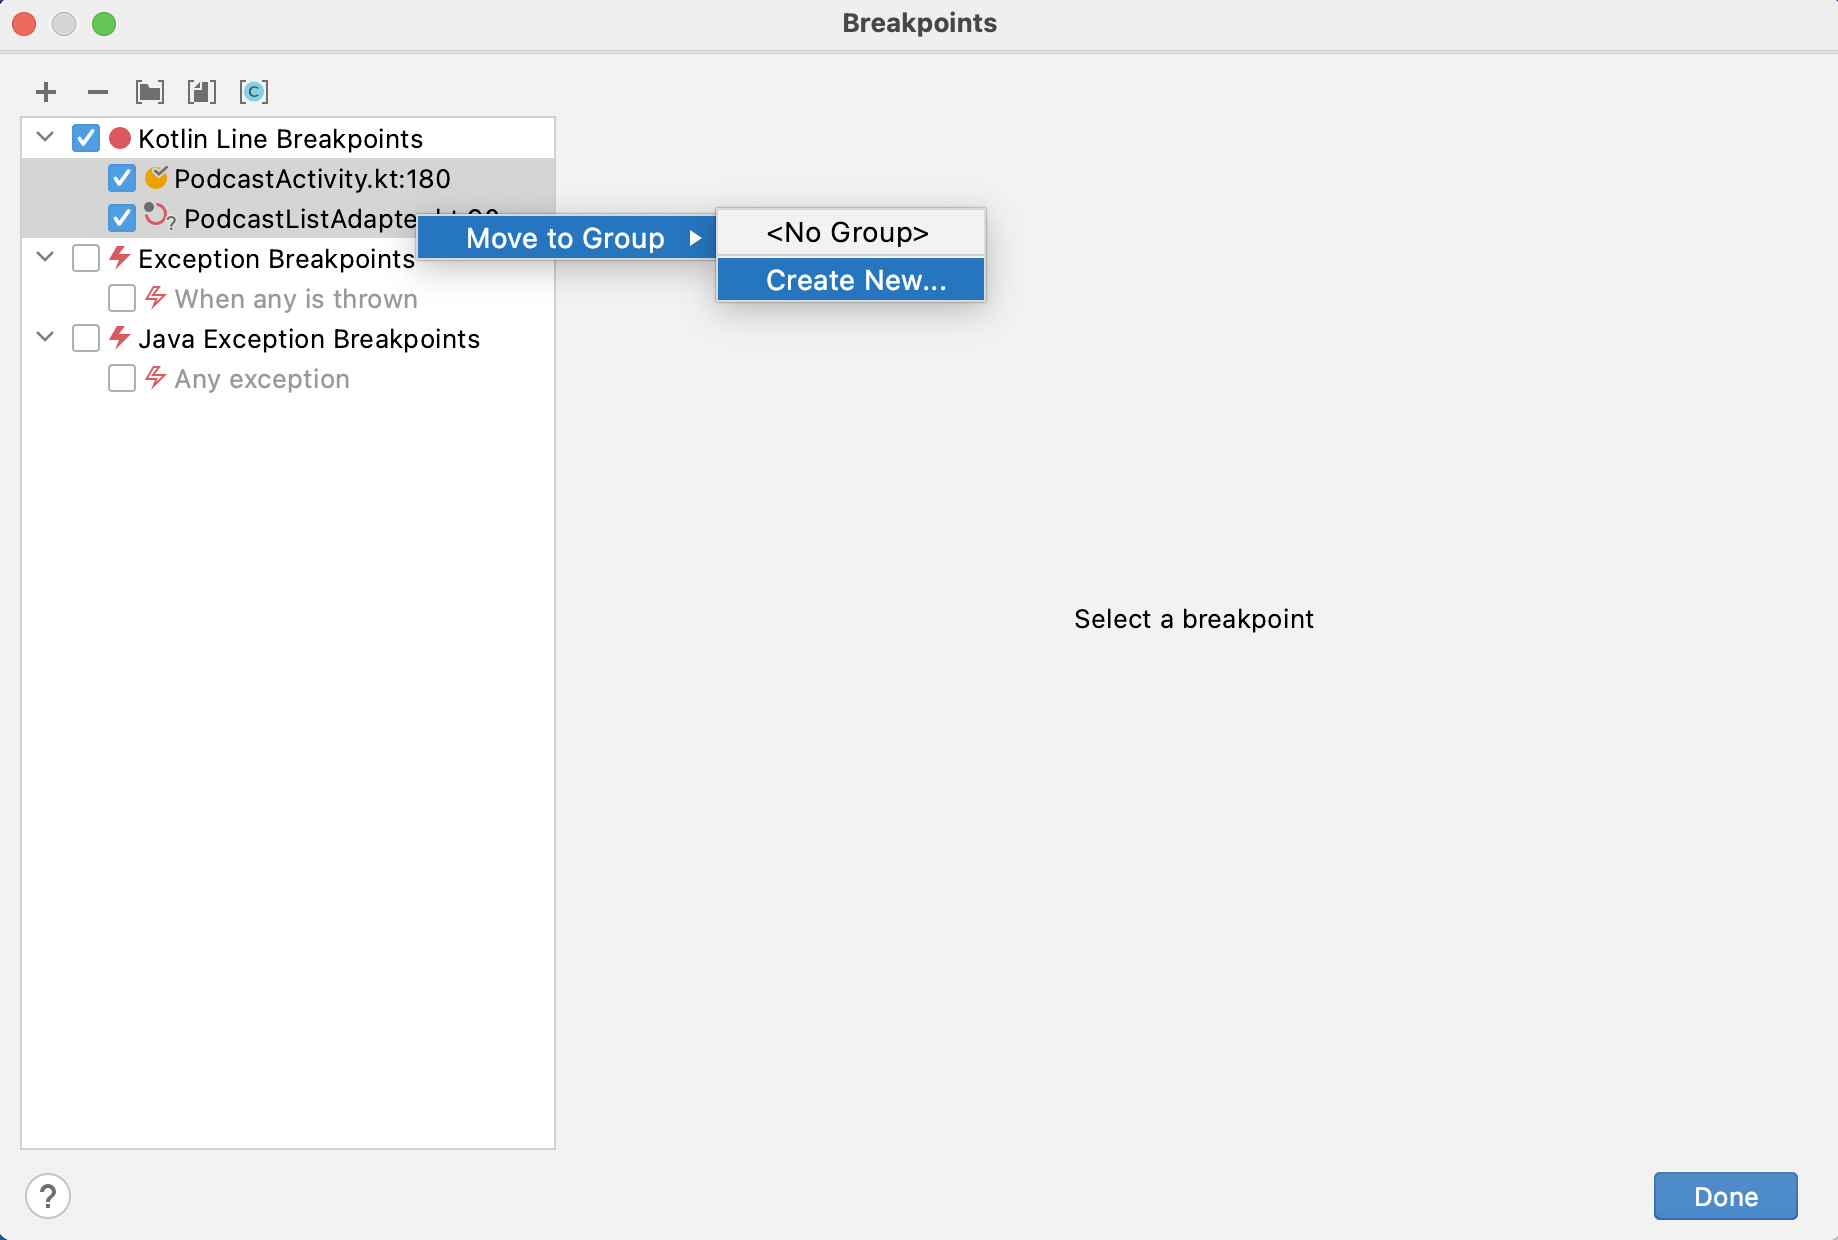
Type in the name “Android Developers Backstage Bug” and click OK.
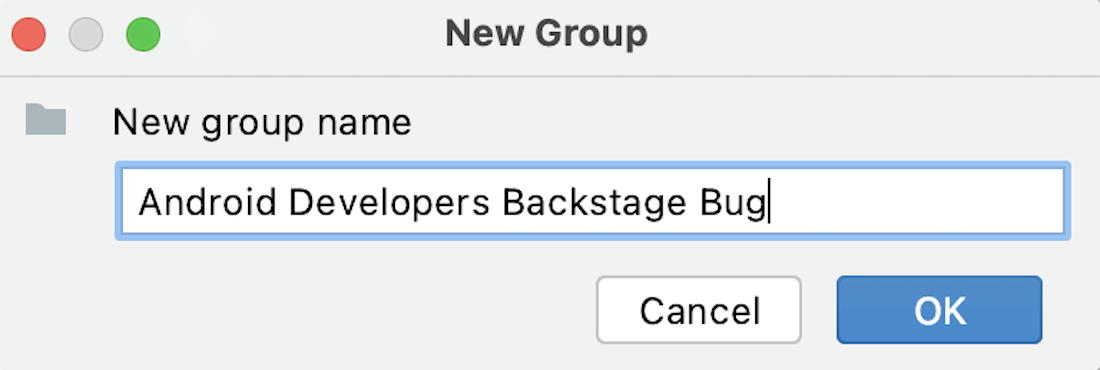
Your breakpoints have now moved to the group of Android Developers Backstage Bug in the Breakpoints window:
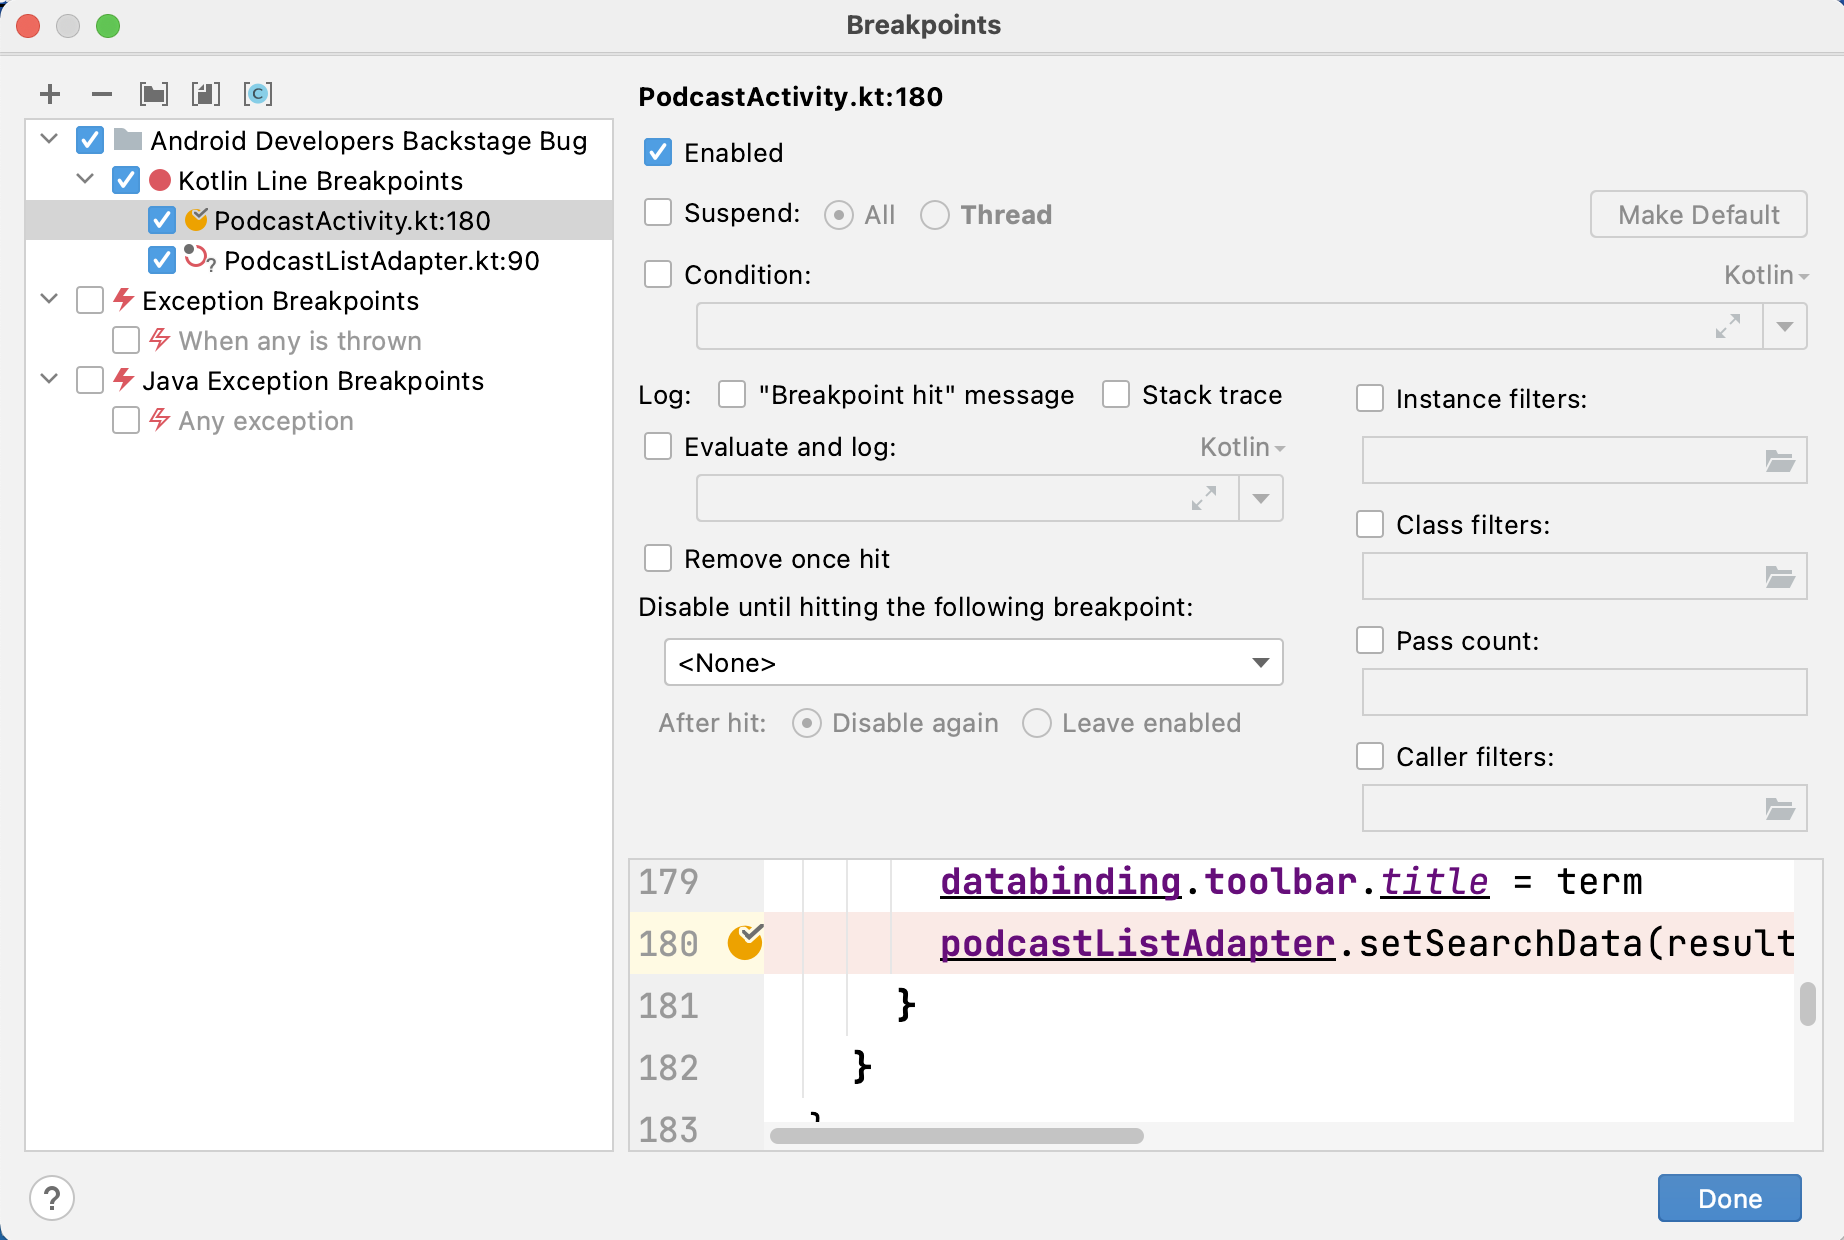
You can toggle these breakpoints on and off by clicking the checkbox next to the new group. This allows you to continue to work on other activities within your project and come back to bugs at a later time without having to reset all of the necessary breakpoints.
Using Breakpoints to Log Information
Breakpoints don’t have to result in a paused app; you can use them to log debug information with the power of unsuspended breakpoints. Sending logs from breakpoints can save you from cluttering your program with temporary log statements. Logging from breakpoints also gives the added benefit of being able to disable and re-enable them at will.
In the Breakpoints window, select your PodcastListAdapter breakpoint. Uncheck Suspend and check “Breakpoint hit” message and Stack trace.

Your breakpoint will now never suspend the code execution as you’ve disabled its suspend function; instead, each time it’s hit, a “Breakpoint hit” log will be posted to the debug window, as well as the stack trace.
Click Done and run your app in debug mode.
Search “Android Backstage” in the app by tapping the search icon and then clicking the Debug tab to see the logs that have been emitted:

You also have the power to log any information that you like from breakpoints, not just the stack trace.
Go back to your Breakpoints window and for the PodcastListAdapter breakpoint, un-check “Breakpoint hit” message and Stack trace. Now check Evaluate and log: and input this code:
Log.d("Breakpoint log", "Android Developers Backstage podcast loading, feedUrl: " + summaryItem.feedUrl)
As long as your breakpoint has access to the variables needed in its scope, you can input any type of log code that you need into the Evaluate and log field, logging as little or as much as required. In this case, the breakpoint is logging some useful information, and the podcasts feed URL.
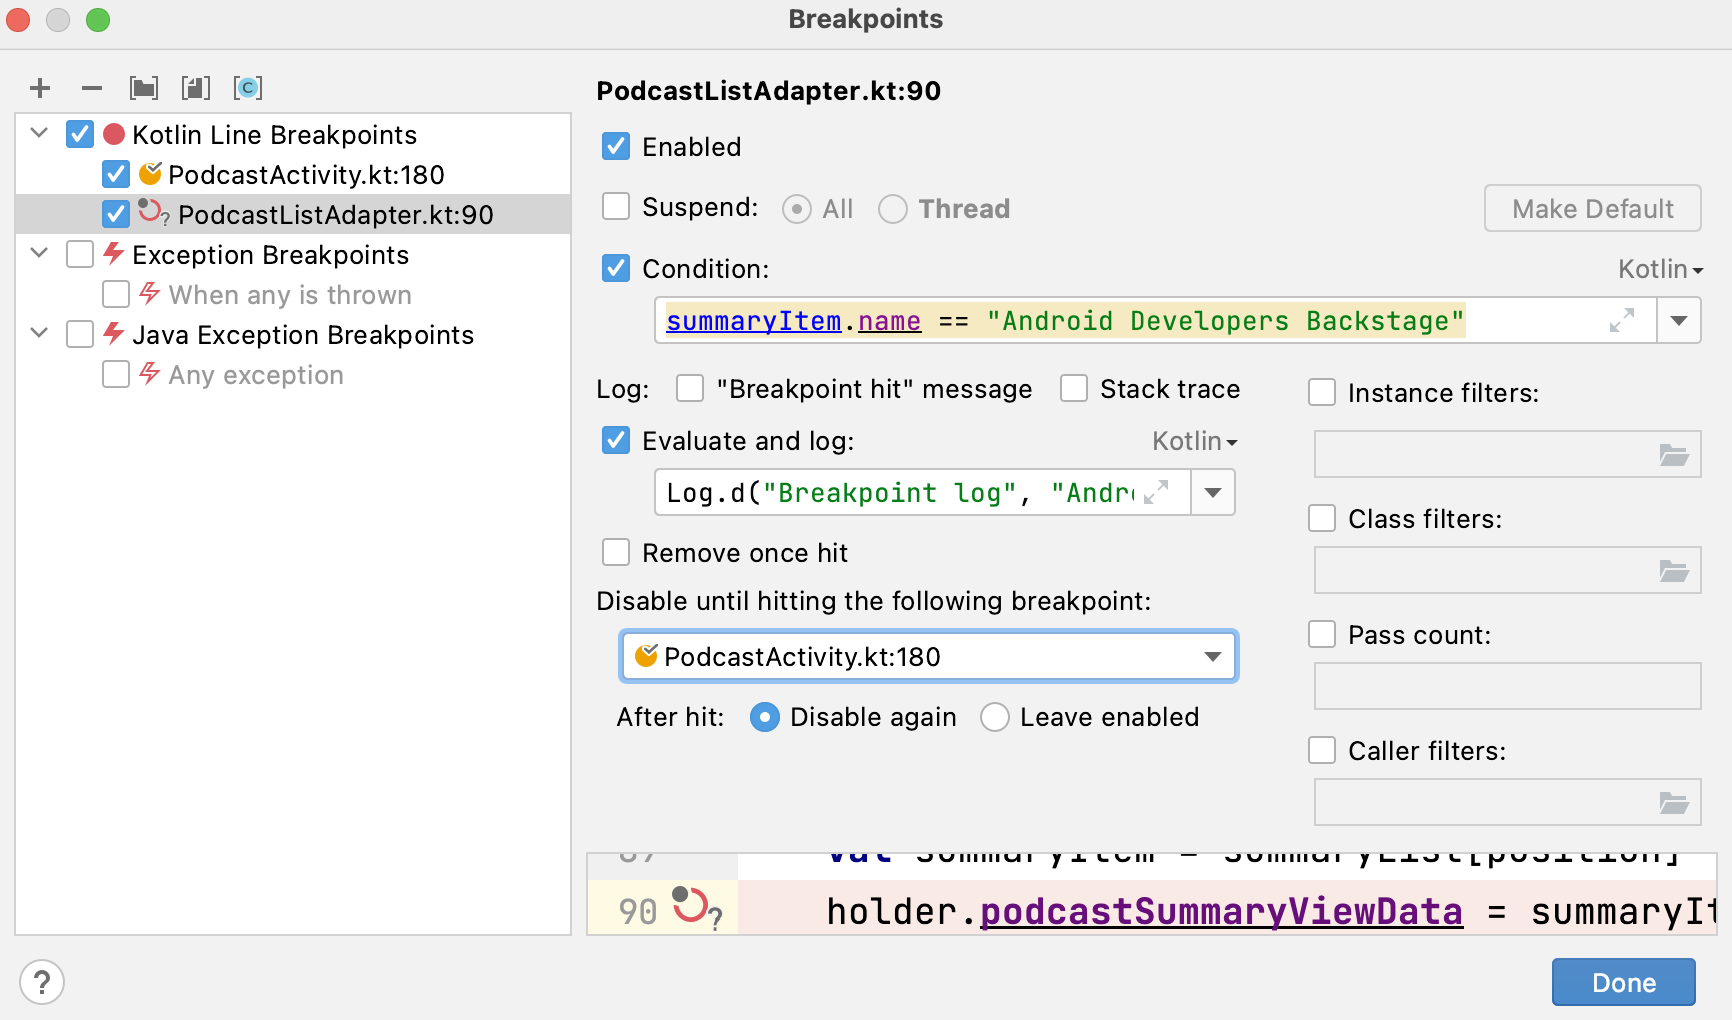
You’ll be prompted to add an import for Log. Go ahead and follow the tooltip prompt to add the import.
Note: If you don’t see the tooltip prompt, set your cursor to
Logand press Option-Return to add the import.
Run your app in debug mode and search for “Android Backstage”. Your Debug tab will now show your custom log message when it’s hit:

Key Points
- Navigate a suspended app by stepping through code with Step Over, Step Into and Step Out.
- Use the Frames pane to navigate to different scopes within your current execution stack.
- Use Drop Frame to go back in time to a previously executed stack.
- Use breakpoint conditions such as depends on and code conditions to control when a breakpoint should register that it’s been hit.
- Use unsuspended breakpoints for breakpoints that shouldn’t pause the code execution.
- Place breakpoints in groups so they can easily be enabled/disabled.
- Breakpoints can log information to the debug console.
Where to Go From Here?
You’re now a breakpoint genius! No longer will you have to rely on in-program logs and tedious trial and error to locate a bug; with unsuspended breakpoints, breakpoint logging, and breakpoint conditions, you can now use logic to squash those bugs faster.
You might be surprised to hear that there are many additional advanced features that breakpoints have that go above and beyond the average debugging requirements of an engineer and can handle the trickiest of bugs; these include functions such as:
- Class filters that limit a breakpoints’ operation to particular classes.
- Caller filters that limit a breakpoints’ operation depending on the caller of the current method.
- Pass count that enables a breakpoint only after it’s been hit a certain number of times.
- Method, field and exception breakpoint types that can be used in addition to line breakpoints.
Read about these advanced features and even more in the excellent IntelliJ documentation for Breakpoints.